Citation
Population Studies, Vol. 58, No. 2, 2004, pp. 233–245
Death and survival during the 1994 genocide in Rwanda
Philip Verwimp
Catholic University of Leuven
This paper reports a quantitative study of the genocide in the prefecture of Kibuye in western Rwanda in
1994. It uses a database produced from a house-to-house survey of victims by the organization of genocide
survivors, Ibuka. For a total of 59,050 victims of the genocide, data were collected on age, sex, occupation,
commune of residence before the genocide, and place and date of death. An analysis conducted for one
commune (Mabanza), showed that the chance of surviving the genocide was higher in those sectors of the
commune where the Tutsi population did not congregate at a football stadium in Kibuye. Those who went
to a mountainous area and defended themselves were almost the only Tutsi still alive in the prefecture after
the month of April 1994. Other determinants of survival included age, sex, and occupation. The number of
deaths each day while the killing lasted is estimated for the whole of the prefecture.
Keywords: genocide; massacre; mortality; survival; Africa; Rwanda
[Submitted September 2002; Final version accepted March 2004]
Introduction
In 1994 Rwanda witnessed a genocide that swiftly
took the lives of some 800,000 Rwandans. In just 3
months, more than 10 per cent of the general population and approximately 75 per cent of the Tutsi
ethnic minority population were killed.
The ethnic composition of the population has been
a major element in Rwandan politics since the era of
colonization. At first, Belgian colonizers had
favoured the Tutsi ruling class, but in the 1950s the
ruling Tutsi began to lay claim to an independent
Rwanda. In response, Belgium provided military and
political aid to the Hutu, enabling a new elite of Hutu
leaders to overturn the privileged position of the
ruling Tutsi, and replace it with the leadership of
Parmehutu, a party committed to the emancipation
of the Hutu. The new rulers, at the national as well as
local level, consolidated their control of the country
by removing all Tutsi from positions of power. A
number of books provide detailed treatment of the
history of Rwanda, including those written by G.
Prunier, C. Newbury, F. Reyntjens, and J. P. Chrétien.
In 1972–73 a group of army officers became frustrated with the monopolization of power by the
group around the President. They organized a coup
d’état and installed a new President, Habyarimana.
He established the Mouvement Révolutionnaire
pour le Dévéloppement (MRND), a single political
party of which every Rwandan was declared to be a
member by birth. Habyarimana’s rhetoric was one of
peace and reconciliation between the ethnic groups
and, partly owing to high coffee prices in the late
1970s and generous donor support, his regime
seemed attractive to a large section of the population.
However, public activity was now tightly controlled.
Movement in and out of the communes was closely
monitored and registered and every adult was
required to participate in weekly communal labour,
umuganda. The President forbade officers and
soldiers to marry Tutsi wives, and required everyone
to participate in weekly meetings in his honour.
In October 1990, a group of Tutsi refugees attacked
Rwanda from Uganda. A civil war followed between
the Rwandan armed forces and a rebel army of Tutsi,
during which the civilian population in the north of
Rwanda were the main victims. During this war, in
the period 1990–93, a total of 2,000 Tutsi were killed
in local massacres. These massacres were not spontaneous outbursts of violence on the part of a poor
peasant population but were organized by the
national power elite (Association Rwandaise pour la
Défense des Droits de la Personne et des Libertés
Publiques 1993; Fédération International des Droits
de l’Homme 1993; United Nations 1993; US Department of State 1993). Then on 6 April 1994, a plane in
which Habyarimana was flying was shot down.
Rwanda descended into genocide.
ISSN 0032-4728 print/ISSN 1477-4747 online/04/020233-13 © 2004 Population Investigation Committee
DOI: 10.1080/0032472042000224422
�234
Philip Verwimp
Aim and method of the study
Aim
This paper presents a statistical analysis of data on
the genocide in the Kibuye Prefecture of Rwanda.
The main purpose of the study was to document the
scale, geography, and pace of the genocide. The next
section describes the data-set used for the study and
provides a general overview of population figures.
This is followed first by an analysis of survival
chances for one commune, and next by estimates of
deaths over time. In order to make the narrative
easier to follow, numerous computations are placed
in the Appendices. We present estimates of the distribution of deaths over time throughout the 3 months
of the genocide for Kibuye in general and for
Bisesero, a mountainous area in Gishyita commune,
in particular. The focus on Bisesero is important
because there the local Tutsi population resisted the
genocide, making it possible to analyse the effect of
their resistance on the mortality pattern.
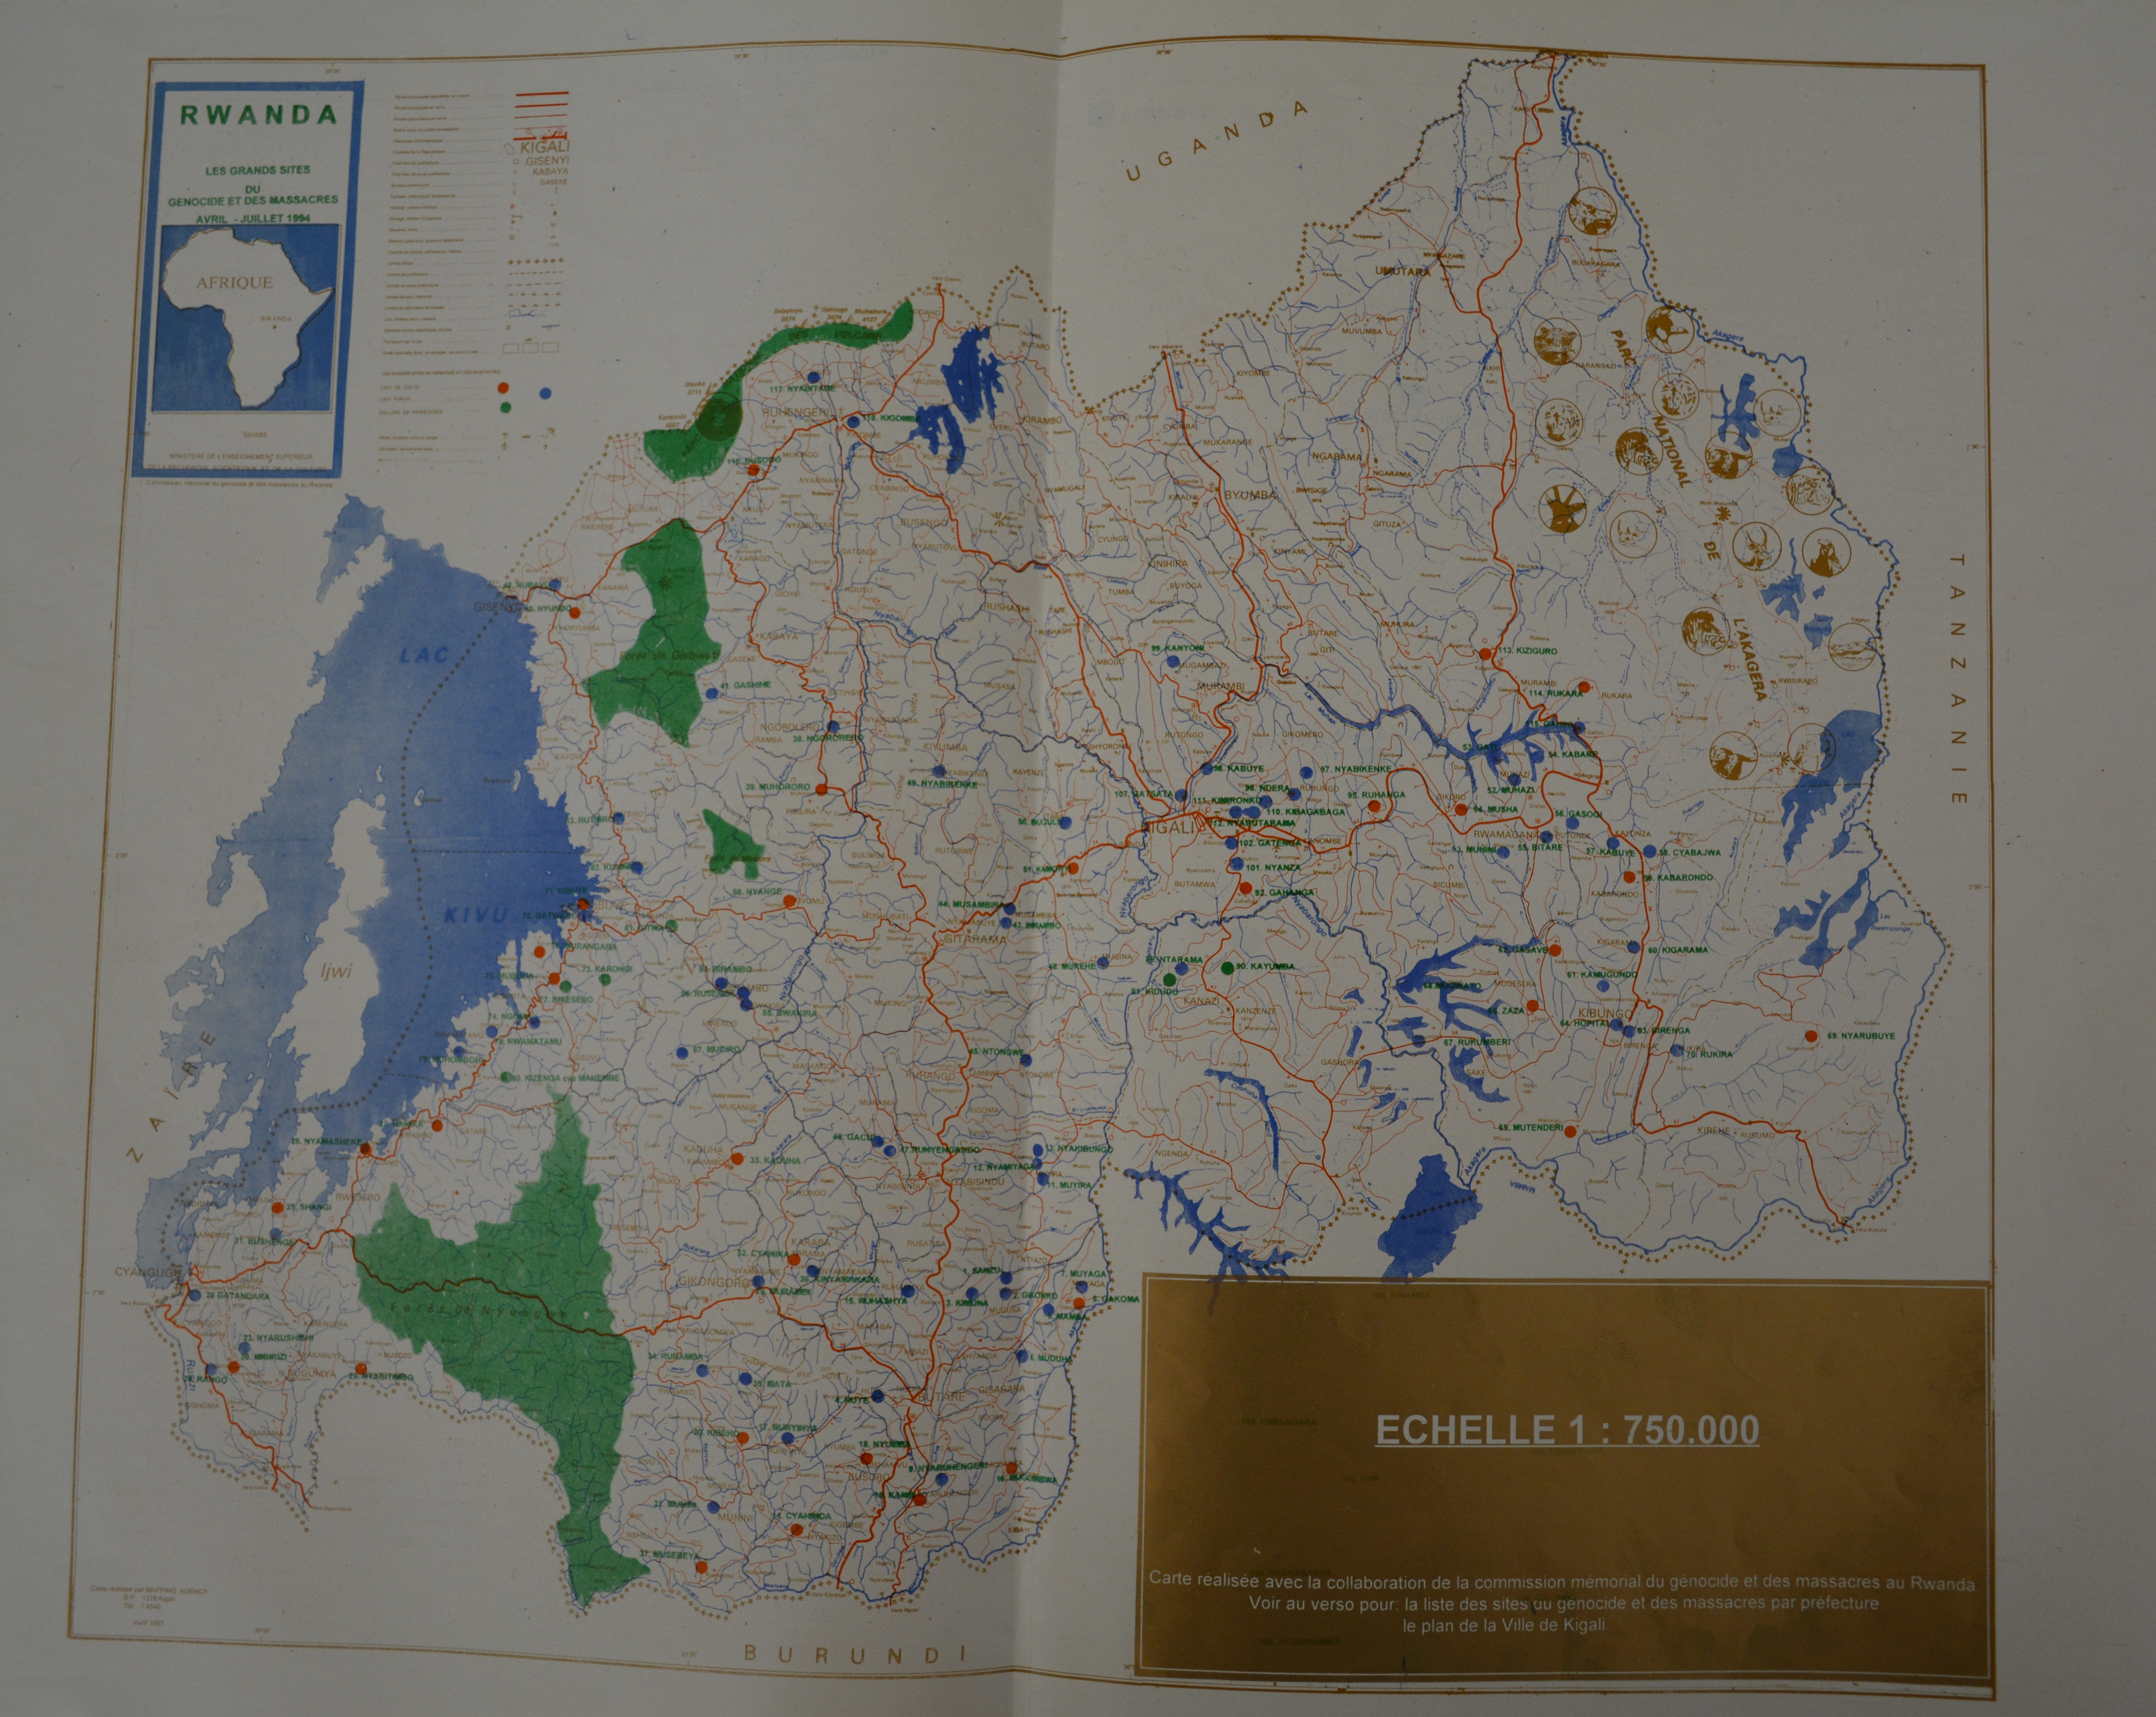
According to the non-governmental organization
African Rights, the genocide in Kibuye Prefecture
was the most complete genocide of all the prefectures
in Rwanda (African Rights 1995, p. 394). Locked in
(see Figure 1) between the prefectures of Gisenyi in
the north, Gitarama in the east, Cyangugu in the
south, and Lake Kivu in the west, the Tutsi from
Kibuye had nowhere to flee. Knowing that they had
to rely solely on themselves, a large number of
them—estimated in this paper at almost one quarter
of all the Tutsi killed in the prefecture—mounted a
strong resistance against their attackers in Bisesero.
They succeeded in defending themselves for more
than a month after the start of the genocide, and their
fate differed from that of other Tutsi in the prefecture. As I document later in the paper, 75 per cent of
the Tutsi from Kibuye were killed before the end of
April 1994, with the Tutsi of Bisesero being the main
exceptions.
Data collection
The data-set used for the study reported in this paper
is a register of individuals who were victims of the
genocide in Kibuye Prefecture. The register was
compiled by Ibuka, an organization of survivors of
the genocide, and published in 1999. As well as the
name of the victim, Ibuka representatives registered,
whenever possible, the victim’s age, occupation, place
Gisenyi
Ru
Ma
II
Kivu Lake
Kibuye
Ki
Git
Bw
Gy
Rw
Kigali
Gitarama
Go
Cyangugu
Mw
Gikongoro
0
50
km
Communes of Kibuye
(Ru) Rutsiro; (Ma) Mabanza; (Ki) Kivumu; (Git) Gitesi; (Bw) Bwakira; (Mw) Mwendo; (Go) Gisovu;
(Gy) Gishyita; (Rw) Rwamatamu
Bisesero sector in Gishyita commune
Figure 1 Map of Kibuye Prefecture, Rwanda
�Death and survival during the 1994 genocide in Rwanda 235
of death, and the weapon used. The register contains
the names and other details of almost 60,000 victims.
The registration procedure was based on the
administrative organization of Rwanda. A prefecture
is divided into nine communes, each with 50,000
inhabitants on average. Each commune is subdivided
into several sectors, and each of these into several
cells. Commune by commune, sector by sector, and
cell by cell, Ibuka representatives visited the families
of Tutsi survivors and of those Hutu who had not
participated in the genocide, to discover the names
and other details of the murdered Tutsi. The majority
of the enumerators had secondary-school education
and had come from, or were familiar with, the
commune in which they were conducting the survey
of victims. There was at least one enumerator per
sector, and one supervisor for each commune who
monitored the work of about 20 enumerators.
Neither enumerators nor supervisors received any
training in statistics or interviewing, and the
completeness of data collection differed substantially
between communes and sectors. According to the
accounts of individuals I interviewed, most of the
information supplied for the register came from Hutu
(most Tutsi having died), who presumably had no
incentive to inflate victim figures, indeed might have
been more likely to do the opposite. It was also my
impression that Hutu who did not participate in the
genocide were keen to provide accurate information
as a way of emphasizing their innocence.
The published register contains details of the
victims of the genocide, but the original books in
which the data were recorded also contain information on the surviving members of each household,
information similar to that recorded for the victims—
age, sex, occupation, and area of residence. As with
the data on the victims, the completeness of data on
survivors differs substantially between communes
and sectors. As Table 1 shows, the completeness of
data collection was poor for the communes of Gitesi,
Gisovu, and Rutsiro. Funding limitations meant that
only for one complete commune (Mabanza) could
the data-set be computerized, and thus made suitable
for a detailed analysis. For this commune, a data-set
of victims and survivors was created from the original
enumeration records.
Descriptive statistics
The Ibuka project succeeded in identifying 59,050
victims of genocide in Kibuye Prefecture—12 per
cent (59,050 of 500,000) of the population of that
prefecture. Table 2 presents the overall figures. The
figure of 59,050 is an underestimate since not all Tutsi
victims were registered. An undetermined number of
Hutu, either allied with Tutsi by marriage or opposed
to the Habyarimana regime, were also killed but
these deaths were not registered by Ibuka. According
to the 1991 census and the Ibuka register, 12.4 per
cent of the population of Kibuye Prefecture were
killed in the genocide—approximately 83 per cent of
its Tutsi population. Between 15 and 20 per cent of
Tutsi (between 10,000 and 15,000 persons) survived.
Table 3 presents information on the scale of the
genocide in each of the communes of the prefecture.
Since data on ethnic affiliation of population at
commune level were not available for 1991, it is not
possible to determine how many Tutsi survived the
genocide in each of the communes.
Table 1 Author’s assessment of completeness of data by commune on victims of 1994 genocide in Kibuye, Rwanda
Commune
Age
Date of death
Place of death
Data on survivors
Whether recoding of
data from
enumerators’
records worthwhile
Bwakira
Gishyita
Gisovu
Gitesi
Kivumu
Mabanza
Mwendo
Rutsiro
Rwamatamu
+
+
+
+
+
+
+
+
+
–
+
+
–
+
+/–
+/–
–
+
+/–
+
–
–
+/–
+
+/–
–
+
+
+
–
–
+/–
+
+
–
+
Yes
Yes
No
Partly
Partly
Yes
Yes
No
Yes
+ = data collected on the item for most victims; – = data missing; +/– = data for some victims collected but not others.
Source: Ibuka (1999).
�236
Philip Verwimp
Table 2 Summary statistics for genocide in Kibuye
Prefecture
Number1 Per cent
Total population of the prefecture
in 1991
Population registered as Hutu
Population registered as Tutsi
Population registered as Twa
Foreign, other, or undetermined
Murdered population identified
by Ibuka
473,920
399,470
71,225
1,490
1,735
100
84.3
15.0
0.3
0.3
59,050
12.4
Number
Analysis of survival chances
Mabanza commune and Kibuye’s football
stadium
According to the Ibuka register and details of
another 500 victims identified after its publication,
there were 9,257 Tutsi victims of the genocide in
Mabanza commune, which means that 86 per cent of
Tutsi in the commune were killed (Table 4). There
were 1,477 survivors.
Table 5 shows where in the commune the Tutsi
residents were killed. About 20 per cent (and 25 per
Per cent2
Table 4 Death and survival in Mabanza commune
Tutsi population registered as
murdered
Tutsi population not registered
as murdered
59,050
82.9
12,175
17.1
1No figures are available for population size in March 1994.
Total population in the prefecture probably reached
500,000 (≅ 473,920 * (1.03)2) by March 1994.
2Taking into account population growth, the figures would
be 78 per cent registered as murdered and 22 per cent not
registered.
Sources: Ibuka (1999); National Population Census (1991).
Total inhabitants registered in the 1991 census 63,460
Total inhabitants in 1994 (1991 figure * (1.03)2) 67,325
Total of Tutsi residents in computerized
database
10,785
Total number of victims
9,257
Total number of survivors
1,477
Number registered by name only
51
Number killed as percentage of 1994 inhabitants
13.7
Percentage of Tutsi killed
86.2
Percentage of Tutsi who survived
13.8
Source: Ibuka (1999) and enumerators’ original records.
Table 5 Places where Tutsi residents of Mabanza were
killed in the 1994 genocide
Table 3 Victims of 1994 genocide in Kibuye Prefecture by
commune
Commune
Bwakira
Gishyita
Gisovu
Gitesi
Kivumu
Mabanza
Mwendo
Rutsiro
Rwamatamu
Total
11991
Number of
victims
shown in
Ibuka
register
Percentage of
population
killed2
53,555
43,090
39,365
61,341
55,361
63,460
43,632
56,768
54,494
4,674
11,273
3,003
11,118
3,934
8,782
4,472
941
10,853
8.7
26.1
7.6
18.1
7.1
13.8
10.2
1.6
20.0
471,066
59,050
12.5
Number of
inhabitants
19911
census data on ethnic affiliation by commune were
not available.
20.5 per cent less when population growth between 1991
and 1994 is taken into account.
Sources: As for Table 2.
Place of victim’s death
Number
of victims
Per cent
In the cell of residence
In another cell within the sector
In another sector within the
commune
In the Gatwaro Football Stadium
In Nyamagumba1
In Bisesero2
In the Kivu Lake
Any another place
Place unknown
1,905
836
20.5
9
329
3,359
677
300
18
645
1,188
3.5
36.2
7.3
3.2
0.2
10.0
12.8
Total
Place unknown
9,257
8,069
100
87.1
1Name
given by the perpetrators of genocide to a hill in
Kibingo sector. The name is the same as that of a hill in
Ruhengeri Prefecture where Tutsi were killed in 1963–64.
Tutsi from the northern sectors (Kibingo and neighbouring
sectors) of Mabanza commune did not gather at the
community office, but took refuge at ‘Nyamagumba’ and
there resisted the Interahamwe and units of the army from
9 to 12 April 1994.
2‘Bisesero’ means the hills of Bisesero.
Source: As for Table 4.
�Death and survival during the 1994 genocide in Rwanda 237
30
20
10
Gi
tw
Ki a
bir
ir
Ki a
ge
y
Ki o
bin
go
Mu
sh
Ny ubat
i
ag
Ny atov
u
aru
ge
Ru nge
be
n
Ru gera
ka
rag
ara
0
ca
ha
ra
Colonel Patrick Sartre told Reuters that at least 4,500 Tutsi,
including women and children, were slaughtered in the
Kibuye Stadium on 16 and 17 April. He calculated that
about 12,000 Tutsi had been murdered in those two days, at
the church, in the stadium, and in the surrounding countryside. Lt. Colonel Eric de Stabenrath told Keith Richburg of
The Washington Post that he found 4,300 bodies piled on
top of each other in Kibuye’s church and 7,000 to 9,000
more bodies in a sports stadium. From his investigations, he
established that Tutsi refugees who had sought shelter at
the stadium had been attacked by soldiers and militia who
had continued shooting until they had run out of ammunition. He concluded that between 80 and 95 per cent of the
Tutsi population had been massacred in this area.
40
Gi
Blam writes (p. 108) that these refugees were
telling stories of terrible massacres of groups of
refugees in Rutsiro commune. The figures of (at least)
10,000 refugees overall and 5,000 in the Gatwaro
Stadium are similar to those reported by French army
officers. African Rights (1995, pp. 416, 424) quotes
two French officers who conducted on-site investigations some time after their arrival:
Ga
ca
waves of refugees, most of them from Mabanza, arrived and
by Friday 15 April, more than 10,000 were concentrated in
the town of Kibuye. More than 5,000 were in the Gatwaro
Football Stadium next to the hospital [where he resided],
several thousand were in the grounds of the Catholic parish
church, and an undetermined number were with friends or
parents on the islands close to the Kivu Lake.
It is impossible to say precisely how many Tutsi
were killed in the Gatwaro Stadium. Blam says he
saw more than 5,000 refugees before the massacre.
Colonel Patrick told Reuters that 4,500 people were
slaughtered in the stadium, while Lt. Col. Stabenrath
counted 7,000–9,000 bodies. According to the Ibuka
register, the stadium was the place of death of 4,179
victims, of whom 3,359 came from Mabanza. The
latter figure is certainly an underestimate since the
place of death was not recorded in many cases.
In Figure 2, we observe between-sector variation
in Mabanza commune. Tutsi were most likely to
survive if they resided in Gacaca or Kibirira sectors,
where 24.5 and 30 per cent, respectively, of the Tutsi
population survived. The place with the highest
percentage of survivors in Mabanza, 58 per cent, was
a cell in Kibingo sector that had a relatively high
number of Tutsi. Further analysis of data on variation
between sectors reveals a systematic component: it is
the sectors whose Tutsi inhabitants did not march to
the Gatwaro Stadium that had higher overall
percentages of survivors.
The sectors can be divided into two groups by
whether the number who died in the Gatwaro
Stadium was more or less than 50 per cent of the total
number of victims. Group 1 (less than 50 per cent)
comprises: Buhinga, Gacaca, Gihara, Gitwa, Kigeyo,
and Rubengera. Group 2 (more than 50 per cent)
comprises: Kibirira, Kibingo, Mushubati, Nyaragatovu, Nyarugenge, and Rukaragara. On average, 20.9
per cent of the victims in the first group died in the
Percentage survived
cent of those for whom cell of residence is known)
were killed in their cell of residence. More than one
in three (36.2 per cent) were killed in the Gatwaro
Football Stadium, which is situated in the centre of
the town of Kibuye, some 10–15 km away from
Mabanza. The evidence from the register that the
majority of Tutsi killed in Kibuye town centre came
from Mabanza commune is supported by accounts
obtained from interviews with survivors and the
eyewitness account of a German expatriate doctor,
Dr W. Blam, who stayed in Kibuye town until his
evacuation in mid-May. He recalls survivors telling
him that several thousand Tutsi gathered at the
commune office in Mabanza. There the mayor told
them repeatedly over 2 days not to leave the
compound. Subsequently Tutsi from other Kibuye
communes arrived, and the mayor then said he had
received an order to send everybody to Kibuye town.
On Wednesday 13 April, they were forced to march
to the Gatwaro Football Stadium in Kibuye town
centre, some 15 km away (African Rights 1995).
According to Blam (1994, p. 108), who was
working for the German Development Cooperation,
in the few days following 11 and 12 April:
Figure 2 Probability of surviving the genocide in the
Mabanza commune by sector
Source: As for Table 2
�238
Philip Verwimp
Table 6 Chance of surviving the genocide in two different groups of sectors in Mabanza commune
Per cent victims killed in Gatwaro Stadium
Killed in or survived the genocide?
Killed
Number
Per cent
Survived
Number
Per cent
Total
Number
Per cent
Chi-square tests of the difference in chance of survival
Value
Pearson chi-square
96.898
Number of valid cases
10,668
<50 per cent
Group 1
>50 per cent
Group 2
4,609
83.1
939
16.9
5,548
100
4,590
89.6
530
10.4
5,120
100
df
1
p (two-sided)
0.001
Total
9,199
86.2
1,469
13.8
10,668
Source: As for Table 4.
Gatwaro Stadium, and 63.3 per cent in the second
group.
Tests of the significance of the difference in survival
chances between each group are shown in Table 6.
Tutsi from sectors with relatively few victims killed in
the Gatwaro Stadium had a significantly higher
overall chance of survival. In the first group of sectors,
16.9 per cent survived the genocide, compared with
only 10.4 per cent in the second group. In contrast, we
do not find a higher percentage of survivors in the
sectors whose population sought refuge in
Nyamagumba and fought the Interahamwe there.
(The Interahamwe—‘those who fight together’—
were the civilian death squads who, with State encouragement and support, carried out the massacres.
A total of 677 Tutsi fled to Nyamagumba, and this
destination was especially popular among refugees
from the sectors of Kibingo and Rukaragara. While
both belong to group 2, the proportion surviving was
much higher in Kibingo (22.3 per cent) than in Rukaragara (6.5 per cent). Although few Tutsi from these
two sectors went to the Gatwaro Stadium, it does not
follow that fighting the Interahamwe increased refugees’ survival chances. It seems that only escaping to
Zaire or going into hiding really improved their
chances.
In total, there were 3,566 people in Mabanza
whose date of death is known. Almost half of all Tutsi
from Mabanza commune with known dates of death
died either on 13 April, when Nyamagumba was
attacked, or on 17 April, which was the date of the
massacres in the grounds of the Catholic parish
church of Kibuye and the Gatwaro Football Stadium.
However, more of the dates of death of the victims
who died in these major massacres are known than
those of victims who were killed in their houses, in
the woods, or in the hills—50 per cent compared with
30 per cent.
Determinants of survival
Logistic regression (Liao 1994) was used to model the
determinants of survival, with age, sex, occupation,
and sector of residence as explanatory variables.
Ninety per cent of Tutsi adults in Mabanza were
farmers. The population of non-farmers was higher
there than in other rural areas because it had a
concentration of schools and small-scale trade. The
number of people included in the regression is 8,289
(the number for whom complete information was
available).
Table 7 shows the results. All the variables, except
sex and four of the sector dummies, are significant at
the 5 per cent level. The effects of the age variable are
quadratic. The probability of surviving the genocide
increases with age to a maximum at age 20 (0.0442/(2
* 0.0011)) and decreases again at older ages. Except
for older women, women’s chances of survival were
no higher than those of men. Tutsi with non-farming
occupations had a better chance of surviving than did
farmers and schoolchildren. This may have been
because they were better informed than farmers and
chose to flee earlier, or because they were physically
better able to flee, or because they had more cash
with which to pay off the Interahamwe. Probably all
these reasons applied to some extent. Compared with
Buhinga sector, the sectors whose Tutsi population
did not go to the Gatwaro Football Stadium had
higher survival proportions.
�Death and survival during the 1994 genocide in Rwanda 239
Table 7 Determinants of survival in Mabanza commune:
results of logistic regression, with survival as dependent
variable. N = 8,928
Explanatory variables
Individual characteristics
Age
Age2
Sex
Age * Sex
Off-farm
Sector dummies
Gacaca
Gihara
Gitwa
Kibirira
Kigeyo
Kibingo
Mushubati
Nyagatovu
Nyarugenge
Rubengera
Rukaragata
Constant
Coefficient
SE
0.0442*
–0.0011*
0.2312
0.0110*
0.6589*
0.0096
0.0001
0.1447
0.0051
0.1391
1.2155*
–0.3640
0.8141*
1.6166*
–0.1128
1.2329*
0.7198*
0.5897*
–0.0324
0.4016*
–0.0456
–2.9649*
0.1675
0.2211
0.1847
0.1517
0.1743
0.1462
0.1559
0.1590
0.2207
0.1956
0.2334
0.1924
Effects are robust for other specifications of the logistic
regression.
*Significant at the 5 per cent level.
Source: As for Table 4.
The spatial and temporal distribution of
genocide
Dealing with missing data
Of the 59,050 registered victims, date of death is not
recorded in 25,716 cases. Since the number of dates
of death known for each commune varies, it is likely
that the raw data present a biased distribution of
murders over time. To produce an estimate of the
actual distribution, we therefore have to adopt a
procedure that compensates for the poverty of data
for some of the communes. For the communes of
Bwakira, Kivumu, Mabanza, Mwendo, Rutsiro, and
Rwamatamu, we assume that the distribution of the
dates of the murders for which the date is known is
representative of all victims residing in that
commune.
For the communes of Gishyita and Gisovu a
slightly different procedure was used. There are three
reasons for this. First, the victims taking refuge in the
hills of Bisesero died later than the victims killed
elsewhere. (By ‘Bisesero’, I mean the hills in Bisesero
sector where the Tutsi of Gishyita, Gisovu, Gitesi,
and Rwamatamu took refuge and defended them-
selves against the genocide.) Second, especially in
Gishyita commune, where many Tutsi lived, the
number of cases for which the date of death is known
is greater for the victims who did not die in Bisesero.
Thus if we applied the same weight for the whole
commune of Gishyita, the estimate for the victims in
Bisesero would be biased. Third, since it is important
to know how many people died in Bisesero and when
they died, we undertake a separate estimation for
Bisesero. For these reasons, the dates of death of
victims from Gishyita and Gisovu communes are
weighted up according to whether or not they died in
Bisesero.
For the commune of Gitesi, for more than 50 per
cent of the victims, the place of residence is missing
from the register as well as the date of death. Even
when it is registered, the place is often entered as ‘in
the mountains’. Thus for this commune, the Ibuka
register is unreliable and another weighting procedure had to be used. Further details of the treatment
of data for this commune are given in Appendix A and
in Verwimp 2001 and 2003.
Estimates of deaths each day for Kibuye
Prefecture
Using the Ibuka data and the computerized data-set
for Mabanza, and applying a number of assumptions
specified in the Appendices, I estimated the number
of Tutsi who died in Bisesero at 13,000, of whom 6,800
were from Gishyita, 1,333 from Gisovu, 3,700 from
Gitesi, 700 from Rwamatamu, and 400 from
Mabanza.
With the assumptions specified in the Appendices,
it is possible to estimate the distribution of killing
over time in Kibuye Prefecture. The method assumes
that those victims in Bisesero whose dates of death
were recorded are a representative sample of all the
victims of Bisesero. Their dates of death are important because the Tutsi at Bisesero, on average, died
later than the other Tutsi. Since we have dates for
only the 2,500 victims who died in the hills of
Bisesero, these victims are given a weighting factor of
5.2 to yield the estimate of 13,000.
According to the Ibuka data, 340 people died
before 6 April 1994. While it is known from other
sources that several people were killed in the first
months of 1994 in different attacks, the figure of 340
in the first 5 days of April is surprisingly high. Given
that the number of people registered as killed in the
first week of May seems implausibly low, a possible
explanation of the figure for deaths before 6 April is
that the dates for early May were incorrectly
�240
Philip Verwimp
Table 8 Estimated number of victims of genocide in Kibuye Prefecture (including Bisesero) each day from 1 April 1994
onwards
Date
April 1
April 2
April 3
April 4
April 5
April 6
April 7
April 8
April 9
April 10
April 11
April 12
April 13
April 14
April 15
April 16
April 17
April 18
April 19
April 20
April 21
April 22
April 23
April 24
April 25
April 26
April 27
April 28
April 29
April 30
May 1
May 2
May 3
May 4
May 5
May 6
May 7
May 8
May 9
May 10
May 11
May 12
May 13
May 14
May 15
May 16
May 17
May 18
May 19
May 20
May 21
May 22
May 23
May 24
May 25
Number of Tutsi
killed for whom date
of death known
134
7
7
175
17
11
63
193
379
655
952
2,398
3,683
3,492
2,468
2,525
1,629
1,194
312
681
146
100
84
203
207
76
43
870
59
81
67
136
39
32
51
22
9
36
28
103
37
57
782
227
203
69
24
53
20
97
26
14
14
13
71
Estimated number of
Tutsi killed1
134
7
7
175
17
20
160
445
1,133
1,503
2,135
4,238
6,408
6,206
4,416
4,839
5,296
3,488
1,392
1,506
300
208
163
772
501
142
93
1,099
101
179
212
547
146
86
173
62
37
157
66
342
100
205
3,654
1,029
902
231
111
209
54
361
93
40
52
44
291
Per cent
0.2
0.0
0.0
0.3
0.0
0.0
0.3
0.8
1.9
2.5
3.5
7.1
10.8
10.5
7.4
8.2
9.0
5.9
2.3
2.5
0.5
0.4
0.3
1.2
0.9
0.2
0.2
1.9
0.2
0.3
0.4
0.9
0.3
0.1
0.3
0.1
0.1
0.3
0.1
0.6
0.2
0.4
6.2
1.7
1.6
0.4
0.2
0.4
0.1
0.6
0.2
0.1
0.1
0.1
0.5
Cumulative per cent
0.6
0.7
0.7
1.1
1.2
1.2
1.5
2.2
4.2
6.7
10.1
17.2
28.1
38.6
46.0
54.2
63.2
69.1
71.4
73.9
74.4
74.8
75.1
76.3
77.2
77.4
77.6
79.5
79.7
80.0
80.4
81.3
81.6
81.7
82.0
82.1
82.1
82.4
82.5
83.1
83.3
83.7
89.9
91.6
93.2
93.6
93.8
94.2
94.2
94.8
95.0
95.1
95.2
95.3
95.8
�Death and survival during the 1994 genocide in Rwanda 241
Table 8 Estimated number of victims of genocide in Kibuye Prefecture (including Bisesero) each day from 1 April 1994
onwards (Continued)
Date
May 26
May 27
May 28
May 29
May 30
May 31
All of June and later
Total
Number of Tutsi
killed for whom date
of death known
Estimated number of
Tutsi killed1
21
0
33
15
34
13
771
69
0
93
46
131
65
2,120
25,716
59,050
Per cent
0.1
0
0.2
0.1
0.2
0.1
3.5
Cumulative per cent
95.9
95.9
96.1
96.2
96.4
96.5
100.0
100
1Number
derived by applying estimation procedure.
Source: Ibuka (1999).
7000
Number of victims
6000
5000
4000
3000
2000
1000
0
01
-A
p
07 r-94
-A
p
13 r-94
-A
19 pr-94
-A
p
25 r-94
-A
01 pr-9
-M 4
07 ay-9
-M 4
13 ay-9
-M 4
19 ay-9
-M 4
25 ay-9
-M 4
a
01 y-94
-Ju
07 n-94
-Ju
13 n-94
-Ju
19 n-94
-Ju
25 n-94
-Ju
01 n-94
-Ju
l-9
4
recorded as having occurred in early April. Adding
the figures for 1 April to the figures for 1 May (and
for those of 2–5 April to those of 2–5 May) is likely
to yield more accurate figures for the murders in the
first week of May.
Measured in numbers of people killed per day, the
genocide in Kibuye reached its peak in the middle of
April. Seventy-five per cent of Kibuye’s Tutsi killed
during the genocide were killed in the first few weeks.
After 50 days (by the end of May), the genocide had
been almost completed in Kibuye, leaving 59,050
dead. This represents a daily average of 1,200 Tutsi
killed. During the first few weeks, however, many
more people were killed per day. Between 7 and 21
April, Tutsi were killed at a rate of 3,000 per day (75
per cent of 59,050 divided by 15 days) on average.
Numbers peaked on 13 and 14 April when an estimated 6,408 (10.8 per cent of 59,050) and 6,206 Tutsi
were killed (see Table 8).
Most Tutsi were killed in the first 2 weeks of the
genocide, with losses being especially heavy in the
communes of Rutsiro, Mabanza, Rwamatamu, and
Gishyita. Two of the lower peaks in Figure 3 are for
28 and 29 April, which is when massacres occurred at
Kiziga Hill in Rwamatamu commune. Among
survivors, 13 May is known as the date on which
Interahamwe from Kibuye, Cyangugu, and Gisenyi
assembled in Bisesero to kill the Tutsi there. They had
succeeded in staying alive there until then by making
good use of the steep hills and throwing stones at
their attackers. They could not, however, withstand
the overwhelming firepower of the assembled
Interahamwe, and the course of the subsequent
massacre is shown in Table 8.
Date of death
Figure 3 Estimated number murdered each day in Kibuye
Prefecture (including Bisesero) from 1 April to 1 July 1994.
N = 59,050
Source: Ibuka (1999)
Population statistics
Owing to the speed of the genocide in Kibuye
Prefecture, it was virtually impossible for the
Prefect of Kibuye, Clément Kayishema, to make a
day-by-day head count of all the victims in the
prefecture. However, as Alison Des Forges (1999,
p. 239) writes:
Administration officials very carefully recorded changes in
the population before the genocide, noting births, deaths,
�242
Philip Verwimp
and movement into and out of the commune on a monthly
as well as a quarterly basis. With these data, officials knew
how many Tutsi, whether male or female, adult or child,
lived in each administrative unit, information useful in any
attempt to eliminate them. Prefect Kayishema was so
concerned about the accuracy of these data that he took
time in early May to review census data submitted by
mayors for the last quarter of 1993. He found errors in at
least two of the reports, that of Mabanza, which recorded
the increase in female Tutsi as 52 instead of 53, and that of
Rwamatamu where an error of 7 was made in accounting
for the male Tutsi population and an error of 6 was made
in recording that of female Tutsi.
It is clear that population statistics in Kibuye
Prefecture, and especially the accurate reporting
system of demographic changes that existed in
Rwanda before the genocide, became a deadly tool
in the hands of the prefect. Des Forges writes that
during the genocide, administrators gave orders that
all details of all displaced persons should be immediately registered (p. 240). She also refers to documents
in which the mayor of Bwakira commune asked
councillors to submit a list of heads of household who
had died, the number of people in the household
killed, and the number who had fled (pp. 240–1). The
use of statistics in the pursuit of genocide is not
unique to Rwanda. Dealing with a European
example, Seltzer (1998) reveals the intricate ways in
which statistics and statistical systems were involved
in the planning and advancement of the genocide
against the Jews in Nazi Germany, Poland, France,
the Netherlands, and Norway. A highly disturbing
feature of the Rwandan case is the fact that the international community did not take action against the
registration of ethnicity on the identity cards of
Rwandans when this could have saved thousands of
lives. According to Des Forges (p. 17), influential
donors overlooked the systematic discrimination
against Tutsi before the genocide and did not insist on
the elimination of ethnic affiliation on the cards that
served as death warrants for many Tutsi in 1994. The
identity cards helped the Interahamwe to discover
who were Tutsi among a crowd of people.
In documents related to the massacres, the prefect
used euphemistic language to refer to them. In one
such document (a letter), he writes that ‘calm’ gradually returned from 25 April onwards—meaning that
most Tutsi from Kibuye had been killed by then
(Kayishema 1994). From the end of April, the
prefect tried to restore ‘normality’ in the prefecture.
Children were expected to go back to school and
adults back to work as if nothing had happened.
Referring to the Tutsi who had defended themselves in Bisesero and were among the few still alive,
the prefect describes Bisesero in the letter mentioned
above as a ‘small area of insecurity’. Survivors of the
massacres there told African Rights researchers that
they had seen the prefect there several times. He was
considered one of the leading organizers of the
genocide (African Rights 1998, pp. 18, 28). The
prefect, together with Obed Ruzindana (a wealthy
businessman), Alfred Musema (Director of the tea
factory in Gisovu), and the mayors of Gisovu and
Gishyita had used their cars and the trucks of the tea
factory to deliver Interahamwe and soldiers to the
massacre sites.
Conclusions
This paper has presented a statistical analysis of the
genocide in Kibuye Prefecture, Rwanda. It uses the
register produced by Ibuka, on the assumption that
its data are sufficiently reliable. For one commune,
Mabanza, the data in the enumerators’ original
records, on victims and survivors, were converted into
a computerized database to allow statistical analysis.
This analysis showed that the likelihood of surviving
was better for young adults than for children, the
middle aged, and the elderly, especially for those who
did not join the crowd at the Gatwaro Football
Stadium. The likelihood of survival also depended on
the sector of residence. This is because the Tutsi population in half the sectors of Mabanza commune went
to the football stadium, but Tutsis in the other half
either did not, or were less likely to do so.
In order to estimate the distribution of deaths over
time, it was first necessary to estimate the number of
people killed in the hills of Bisesero. This necessarily
entailed making some assumptions to deal with the
problems of missing data, especially for the commune
of Gitesi. The result is an estimate of 13,000 as the
number of Tutsi killed in the hills of Bisesero. This
estimate was used in a calculation of the number of
Tutsi killed every day in the entire prefecture. The
calculation confirmed that genocide had proceeded
at a very rapid pace. Seventy-five per cent of the Tutsi
of Kibuye had been killed by 22 April—an average of
3,000 murders per day for the first 2 weeks of the
genocide in the prefecture.
As Minna Schrag, a former prosecutor with the
International War Crimes Tribunal for Yugoslavia,
observed at a 1997 conference on the use of quantitative data and analysis ‘data can help us tell the story
of the crime’ (quoted in Seltzer 1998, p. 543). The
analysis presented here supplements narrative
accounts of the genocide in Kibuye with details of its
scale, geography, and pace.
�Death and survival during the 1994 genocide in Rwanda 243
Appendix A: Death and survival in Gitesi
commune
Gitesi commune, which is Kibuye’s ‘urban’
commune, had a large Tutsi population before the
genocide. Unfortunately, there were many gaps in the
data collected there for the Ibuka register. The data
for half the sectors were used to create a computerized database, which was analysed to produce the
results shown in Table B2. The data for the other
sectors are too incomplete to be used. The following
facts were established by enquiries made during a
visit to the commune in October 2000.
(i)
From 6 to 11 April, the great majority of the
Gitesi Tutsi stayed in their homes rather than
gather by the thousand in front of the community office like the Tutsi from Mabanza. That
is why, after 11 April, the Tutsi of Gitesi, unlike
those of Mabanza, were killed at numerous
places throughout the entire commune.
(ii) The dispersion also explains why fewer dates of
death were recorded. Members of the same
household fled in different directions and did
not know the fate of other household members.
(iii) Apparently the mayor did not actively support
the genocide, nor did he oppose it. He behaved
more like a bystander. This may be an additional
explanation of the dispersion of the Tutsi from
Gitesi, at least in the first few days of the
genocide.
(iv) A number of Tutsi from elsewhere in Gitesi
came to Kibuye town centre from 12 April
onwards; however, many of them were killed in
other places throughout the commune.
Appendix B: Estimation of deaths over time
Gishyita and Gisovu communes
For Gishyita commune, it is possible to identify 5,800
residents (out of 11,273) who died in the hills of
Bisesero, because the place of death is mentioned in
the Ibuka register. This figure is the ‘certain’ estimate
for Gishyita. It also proved possible to trace 4,000
residents of the commune who did not die in the hills
of Bisesero, which left about 1,473 Tutsi from Gishyita
whose place of death remained unknown or unclear.
Since many people died in the hills of Bisesero, where
the exact location was more likely to be unknown, I
assume that 1,000 of these 1,473 (two thirds) were also
killed in the hills of Bisesero. This suggests that 6,800
Tutsi from Gishyita, that is, three out of five Tutsi from
Gishyita, were killed at Bisesero.
For Gisovu commune, 1,000 people (of 3,003) died
in Bisesero (the location is indicated in the register)
and 1,500 died in other places. As in the case of
Gishyita, I assume that 333 of the remaining 503 (two
thirds) also died in the hills of Bisesero. Thus an
estimated total of 1,333 Tutsi from Gisovu, 44 per
cent of its Tutsi population, were killed in Bisesero
(Table B1).
Gitesi and Mabanza communes
From interviews in the commune, we know that a
considerable number of Tutsi from Gitesi commune
managed to take refuge in Bisesero. According to
African Rights, Tutsi who had survived several
massacres in Kibuye and Gitesi arrived in Bisesero.
The Tutsi from Gitesi commune more specifically had
survived or escaped massacres at the Gatwaro
Stadium, the grounds of the Catholic parish church
of Kibuye, and a priest’s residence in the grounds.
According to the Ibuka file, however, the majority of
Tutsi who were killed in these places were residents
of Mabanza commune. The figures for Mabanza and
Gitesi commune are shown in Table B2.
In contrast to the Tutsi from Mabanza commune,
many Tutsi from Gitesi commune were not trapped
in the town centre. This does not mean that all the
Gitesi refugees reached Bisesero. Gitesi is adjacent
to Gishyita, but the Bisesero sector in Gishyita
commune borders Gisovu commune rather than
Table B1 Tutsi from Gishyita and Gisovu communes killed in Bisesero
Not killed in Bisesero
Killed in Bisesero
Commune
Total number
of Tutsi killed
Certain
Assumed
Certain
Assumed
Per cent
Gishyita
Gisovu
11,272
3,003
4,000
1,500
4,473
1,668
5,800
1,000
6,800
1,335
60
44
Source: Ibuka (1999).
�244
Philip Verwimp
Table B2 Place of death for Tutsi from Mabanza and
Gitesi communes
Place of death
Mabanza
Gitesi1
Gatwaro Football Stadium
In Bisesero
In the mountains
Other specified places
Unknown
Total number of victims
3,359
300
177
4,233
1,188
9,257
718
360
3,182
4,158
2,432
10,850
1See text for discussion of the data problems for the
commune of Gitesi. In the Ibuka records for Gitesi
commune, cases of unknown place of death were added to
the category ‘in the mountains’, but were assigned
differently when the data were recoded for the computer
analysis. The figures for Gitesi commune are extrapolations
from data recoded for six sectors.
Source: Ibuka (1999).
Gitesi commune. Moreover, a large number of Tutsi
were killed on the roads, in their houses, and while
hiding with friends. The analysis of half the sectors in
Gitesi (see Table B2 and Appendix A) reveals that,
extrapolating to the whole commune, one in three
Tutsi from Gitesi were killed either in Bisesero (3.3
per cent) or ‘in the mountains’ (29.3 per cent), while
8.1 per cent were killed in Karongi and for 22.4 per
cent the location is unknown. For want of reliable
data, we make two arbitrary assumptions: that two
thirds of those who died ‘in the mountains’ went to
Bisesero and that half of those whose place of death
is unknown also went there. These figures yield a
value of 34 per cent (i.e., 3.3 + 19.5 + 11.2) as the
percentage of the 10,850 Gitesi victims who were
killed in Bisesero, or 3,700 persons.
The estimated distribution over time of the
remaining 7,150 victims of Gitesi commune is also
based on the analysis of the data for half the sectors
in the commune and observations from eyewitnesses.
Of the 948 Gitesi victims for whom the date of death
is known, 642 (67 per cent) were killed between 15
and 19 April, with 400 (62 per cent of 642) on 17
April, the day of the massacre in the grounds of the
Catholic parish church of Kibuye. With this limited
evidence, together with interview data (African
Rights, Doctor Blam, and author’s interviews in
Gitesi), we make the following assumptions. Since
the major massacres in that commune took place
from 15 to 19 April, we assume that 4,300 (60 per cent
of 7,150) died during these days, especially on 16, 17,
and 18 April 1994. In the absence of relevant data,
these 4,300 victims are assigned to dates as follows:
250 on Friday 15 April, 250 on Saturday 16, 2,000 on
Sunday 17, 1,000 on Monday 18, and 800 on Tuesday
19. We also assume that the distribution of deaths
over time of the remaining 2,850 (i.e., 10,850 – 3,700
– 4,300) Tutsi from Gitesi commune was the same as
that of the entire prefecture. This is plausible given
the evidence that Tutsis who were hiding in the hills
were hunted down throughout the territory of the
entire prefecture and throughout the 3 months of the
genocide. All weighting factors for each of the dates
are thus augmented in proportion to the number of
people who died on that date, to account for these
remaining 2,850 victims. The database also shows that
a small number of Tutsi from Mabanza died in
Bisesero. Because Mabanza commune does not
border Bisesero sector in Gishyita commune, we
estimate that only a very small percentage of the
‘unknown’ in the Mabanza records reached Bisesero.
In the case of Rwamatamu commune, most Tutsi
were killed in the commune itself and early in the
genocide. Few managed to escape to Bisesero. The
register shows that about 9,000 Tutsi victims from
Rwamatamu were not killed at Bisesero, which
leaves about 1,000 refugees who could have gone
there. The presence of Tutsi from Rwamatamu at
Bisesero is corroborated by interviews with survivors
(see Table B3).
Since the data available for computer analysis
were restricted to the data for the commune of
Mabanza and half the commune of Gitesi, the overall
figure of 59,050 victims found by Ibuka was retained
as a baseline for the estimation over time, which
meant ignoring the small differences found between
the numbers of victims shown in the register for these
communes and the numbers revealed by the
computer analysis using enumerators’ records.
The figure of 13,000 is the estimate of the number
of victims killed at Bisesero. Changing the assumptions made to produce this figure would not make a
Table B3 Minimum, maximum, and most plausible
estimates of number of Tutsi killed in Bisesero by commune
of residence
Commune of
residence
Minimum
or ‘certain’
estimate
Gishyita
Gisovu
Gitesi
Rwamatamu
Mabanza
5,800
1,000
600
400
300
6,800
1,333
3,700
700
400
7,300
1,500
4,000
1,000
800
Total number
8,100
12,933
14,600
Source: Ibuka (1999)
Most
plausible
estimate
Maximum
estimate
�Death and survival during the 1994 genocide in Rwanda 245
big difference. The minimum estimate is the 8,100
victims in the Ibuka records whose place of death is
stated as Bisesero, which is surely lower than the real
number. The most plausible maximum estimate is
14,600. If future research shows that in fact most Tutsi
from Gitesi did not die ‘in the mountains’, as indicated in the Ibuka register, but were killed in other
major massacres in Gitesi commune, the figure of
13,000 Tutsi killed in Bisesero will have to be revised
downward and the figure for those killed in the
grounds of the Catholic parish church revised
upward. On the other hand, if future research shows
that more than 3,700 Tutsi from Gitesi commune
reached Bisesero, the estimate for Bisesero will have
to be revised upward.
The estimate of 13,000 is lower than that given in
other publications. According to African Rights,
50,000 people were killed in Bisesero. This must be an
overestimate because the total number of victims in
Kibuye Prefecture registered by Ibuka is 59,050. The
Ibuka figure may be an underestimate and it includes
only Tutsi living in Kibuye before the genocide, but
the African Rights figure of 50,000 for Bisesero alone
seems implausibly high. If it were accurate, it would
mean either that 10 per cent of the population of the
entire prefecture (or two thirds of all the Tutsi from
Kibuye) had gathered at Bisesero or that a large
number of Tutsi from Gitarama, Gisenyi, Gikongoro,
or Cyangugu prefectures had gone to Bisesero.
Neither occurrence seems very plausible.
Notes
1 Philip Verwimp is at the Economics Department,
Catholic University of Leuven, Naamsestraat 69, 3000
Leuven, Belgium, and is an affiliated research fellow at
the Genocide Studies Programme, Yale University.
Email: philip.verwimp@econ.kuleuven.ac.be
2 This paper was written when the author was a research
scholar with the Fund for Scientific Research (Flanders,
Belgium). The author is grateful to the fund for grants
that enabled him to make two field trips to Rwanda for
research, one in 1999 the other in 2000. The author also
wishes to thank the Rwandan organization of genocide
survivors, Ibuka, and in particular F. R. Ruvukanduvuga,
for permission to use their data file without restriction.
For insightful and critical comments on earlier drafts of
this paper, I am indebted to L. Berlage, S. Cook, S.
Dercon, A. Des Forges, W. Seltzer, seminar participants
in the Genocide Studies Seminar at Yale University, and
two anonymous referees.
References
African Rights. 1995. Rwanda: Death, Despair and Defiance. London: African Rights.
African Rights. 1998. Rwanda: Resisting Genocide.
Bisesero, April–June 1994. London: African Rights.
Association Rwandaise pour la Défense des Droits de la
Personne et des Libertés Publiques (ADL). 1993.
Rapport sur les Violations des Droits de l’Homme au
Rwanda 1990–1993. Kigali: ADL.
Blam, W. 1994. Völkermord als ‘modernes’ Politikinstrument, in Hildegard Schürings (ed.), Ein Volk verlässt
sein Land—Krieg und Völkermord in Rwanda.
Cologne: ISP.
Des Forges, A. L. 1999. Leave None to Tell the Story.
Genocide in Rwanda. New York: Human Rights Watch.
Fédération International des Droits de l’Homme (FIDH).
1993. Report of the International Commission of Investigation on Human Rights Violations in Rwanda since
October 1, 1990. Paris: FIDH.
Ibuka. 1999. Data file Kibuye Dictionary Project. Kigali,
Rwanda: Ibuka.
Kayishema, Clément. 1994. Letter of the Préfet to all the
Mayors concerning the self-defence programme of the
population, on 30 April, 1994. Copy of the letter available from P. Verwimp or Human Rights Watch.
Liao, T. F. 1994. Interpreting Probability Models: Logit,
Probit and Other Generalized Models. Sage University
Papers. Quantitative Applications in the Social Sciences
Series. Thousand Oaks, CA: Sage.
Seltzer, W. 1998. Population statistics, the Holocaust and
the Nuremberg trials, Population and Development
Review 24(3): 511–552.
United Nations. 1993. Report by Mr. B. W. Ndiaye, Special
Rapporteur, on his Mission to Rwanda from 8–17 April
1993. New York: United Nations. Available: http://
www.preventgenocide.org/prevent/UNdocs/
ndiaye1993.htm
US Department of State. 1991 and 1993. Human Rights
Conditions in Rwanda. Washington, DC: US Department of State.
Verwimp, Ph. 2001. A Quantitative Study of Genocide in
Kibuye Prefecture, Rwanda. Discussion Paper, Centre
for Economic Studies, Leuven.
Verwimp, Ph. 2003. Development and genocide in Rwanda:
a political economy analysis of peasants and power
under the Habyarimana Regime. Doctoral dissertation,
Economics Department, University of Leuven.
�