Citation
JOURNAL/ DOUBLE-GENOCIDE
ARTICLE
10.1177/0022002703254478
Verwimp
OF CONFLICT RESOLUTION
THESIS FOR RWANDA
Testing the Double-Genocide Thesis
for Central and Southern Rwanda
PHILIP VERWIMP
Economics Department
Catholic University of Leuven, Belgium
Results of a research project with household-level data on the demographic impact of genocide and civil
war in Rwanda are reported. The survey includes demographic and criminological data on 352 peasant
households that were part of a large household survey project before the genocide. The absolute number of
Hutu killed in the sample is half of the number of Tutsi killed. The statistical and econometric results show
that the killing pattern among Hutu and Tutsi was different; Tutsi members of the same household were often
killed on the same day and in the same place. The effect of the arrival of the Rwandan Patriotic Front (RPF) at
the survey sites on the survival chances of Hutu and Tutsi is estimated.
Keywords: genocide; civil war; survey research; Rwanda
Empirical research at the household level of the transition process from civil war and
genocide to (relative) peace in Rwanda is very scarce. As a result, several important
questions regarding Rwanda are heavily disputed by scholars. One of the most controversial topics in modern Rwandan history is whether more than one genocide occurred
in Rwanda before, during, or after 1994. Reyntjens (1996, 240-51), for example,
writes that the Rwandan Patriotic Front (RPF) killed tens of thousands, maybe hundreds of thousands of Rwandans before, during, and after 1994. Des Forges (1999,
692-735) suggests that the killings by the RPF were more selective, mainly targeting
educated or politically active Hutu. She too acknowledges that the RPF killed tens of
thousands of people. One step beyond this is the claim that the RPF also committed
genocide. In fact, the thesis is of a triple genocide, adding the massacres in the Kivu as
another genocide committed by the Rwandan Patriotic Army (former RPF).
AUTHOR’S NOTE: Many thanks to Dan Clay and the staff of the Food Security Project in Rwanda for
the permission to use the 1989-1992 data set and for help received during the initial phase of the fieldwork.
Lode Berlage, Stefan Dercon, Alison Des Forges, Ben Kiernan, and seminar participants at the Amsterdam
Meeting of Peace Science Society (International), June 12-14, 2002, gave useful and critical comments. The
fieldwork would not have been possible without the dedication of the Rwandan field-workers, funds
received from the National Science Foundation (Belgium, Flanders), and the support of Stefan Dercon,
Lode Berlage, and Els Vanheusden. Data used in this article will be available from http://www.yale.edu/
unsy/jcr/jcrdata.htm 1 year from date of publication.
JOURNAL OF CONFLICT RESOLUTION, Vol. 47 No. 4, August 2003 423-442
DOI: 10.1177/0022002703254478
© 2003 Sage Publications
423
�424
JOURNAL OF CONFLICT RESOLUTION
The lack of empirical research has everything to do with the great number of difficulties that one faces when undertaking this journey. To name just a few obstacles that
have to be tackled: many people are traumatized by the events, people distrust one
another, ethnicity is not used in official parlance but is omnipresent in daily life, the
struggle for life encourages the search for short-term gain and corruption, the ongoing
war in the Congo cuts short any political opening of debate, more than 100,000 people
(many without file or charges) are in prison, and so on.
Despite these difficulties, this study presents demographic findings about the transition of rural households from a period of civil war and genocide to a situation of relative peace. Findings are based on intensive household survey research. The study is the
result of 8 months of field research in Rwanda over a period of 2 years. It will enable us
to test the double-genocide thesis empirically for parts of the country. Because fieldwork was not conducted in the Kivu provinces of the Congo, empirical work on the
massacres in Kivu is not presented.
With good data, one can, for example, analyze the impact of the RPF in surveyed
communities and distinguish it from the impact of the forces that committed the genocide of Tutsi and moderate Hutu in these same communities. What is needed for this is
a detailed data set with the dates, places, ethnic affiliation of the victims, and identity
of the killer(s). This is, among other things, what this empirical study offers. The data
allow us, for example, to observe whether the RPF made as many victims among
Rwanda’s (mostly) Hutu population as the genocide made among its (mostly) Tutsi
population. The data also allow us to test statistically whether the arrival of the RPF
saved lives or caused more deaths among Hutu and Tutsi.
Because of budget limitations and the design of the research project, this study is a
limited test of the double-genocide thesis—specifically, of the prefectures of
Gitarama, Gikongoro, and Kibuye. Advocates of the thesis may argue that it is not a
true test of the double-genocide thesis because most of killings by the RPF occurred in
Byumba, Kibungo, and rural Kigali. This criticism is partially correct. Therefore, I
state at the beginning that the test is a partial one, namely, for parts of Rwanda (the
three above-mentioned prefectures) and not for the entire country. It should be noted,
however, that testimonies about killings organized by the RPF exist for several parts of
Rwanda.1 It is hoped that the advocates of the double-genocide thesis appreciate the
empirical methodology and acknowledge its findings.
Before presenting the results of the fieldwork, we need to discuss the definition of
genocide. First, the internationally accepted legal definition is set out in a United
Nations Convention in 1948. Article 2 in the convention defines genocide as “acts
committed with intent to destroy, in whole or in part, a national, ethnical, racial or religious group.” The most important element in this definition is that it can be used—and
is currently used—in national and international penal tribunals. Scholars, however,
have singled out a number of problems with this definition. These problems are appar1. An example of this is Byumba town. During one of my visits to Rwanda in September 2000, a very
knowledgeable person informed me that during the third week of April 1994 — around April 17 to 19 — a
large number, maybe several thousand, unarmed civilian Hutu men were killed by the Rwandan Patriotic
Front (RPF) in Byumba town. When I asked my informant for the motivation behind this massacre, he said
that revenge most likely motivated these killings - revenge for ongoing killings in the capital, Kigali.
�Verwimp / DOUBLE-GENOCIDE THESIS FOR RWANDA
425
ent when we study large-scale massacres that do not seem to correspond to a complete
or full genocide. Researchers then have the choice of limiting their use of the word
genocide to the very few cases in which there is absolutely no doubt that this word
applies (e.g., the Nazi genocide of Jews) or broadening its use to cover large-scale massacres and take the risk of losing the power of the word. One can indeed argue that the
term has this power when it is used to define just those events (such as the holocaust)
that seem different from other large-scale massacres. This question also touches the
core of the Rwandan situation. Very few scholars doubt the correctness of the application of the term genocide in its legal and broader meaning (in social science research)
to the slaughter that occurred in Rwanda between April and June 1994. However, very
few scholars will use the word genocide to describe the killings committed by the RPF
before, during, and after 1994.
The purpose is not to have a legal discussion of the definition of genocide here;
other authors have much more expertise to do that. I cannot avoid such a discussion,
however, for two reasons. First, the advocates of the double- or triple-genocide thesis
do use the word genocide and thus invoke the legal implications of its use.2 Second,
when I want to distinguish between a “complete” or “full” genocide, on one hand, and
one or more massacres, on the other hand, I need a set of criteria that allow me to make
a such distinction.
The question in the literature is whether the events that occurred in Rwanda
between April and June 1994 are so exceptional that they merit description by a term
not used to describe other kinds of killings. This is exactly where the main contribution
of the study can be situated. I present empirical material to find out whether the killings
committed by the Hutu power regime between April and June 1994 had a different
character from the killings committed by the RPF in Rwanda before, during, and after
1994. Which term, then, is considered to be appropriate in its legal or broader social
science meaning is open for debate.
THE TRACING METHODOLOGY OF
THE GENOCIDE TRANSITION SURVEY
To research the fate of the members of Rwandan households in transition from civil
war and genocide to a situation of relative peace, it was necessary to find and collect
data at the household level. These data had to be unbiased; that is, whatever information on households one could find (e.g., income, household composition, location,
farm size, etc.) should be collected independently of the behavior of household members during the genocide. This condition is not satisfied, for example, when one
researches a sample of perpetrators or a sample of prisoners. Therefore, I decided to
2. See Desouter (1995, 2002). Desouter, who was president of the White Fathers Missionary Society
between 1993 and 1994, writes, for example, that “the Interahamwe are a militia that has pushed young people to protect themselves in a moment of crisis and war” (Desouter 1995, 5). Furthermore, he states “that it is
a lie that the old regime had planned the genocide of the Tutsis” (p. 5). He also says that “from the start it was
a double genocide, whereby from 1990 to 1995 both Hutu and Tutsi were killed” (p. 5). Desouter and
Reyntjens (1995) also documented crimes committed by the RPF.
�426
JOURNAL OF CONFLICT RESOLUTION
trace the rural households that were interviewed by Dan Clay from Michigan State
University and the Department of Agricultural Statistics (DSA) before the genocide.
Clay had interviewed 1,248 rural households from 1989 to 1992 in all Rwandan prefectures. He collected detailed data on the demographic, economic, and agricultural
situation of farm households. This database is a unique source to study the livelihood
of Rwandan peasants before the genocide. The research strategy would give the
researcher data on the fate of rural households during and after the genocide, based on
a pregenocide sample of rural households.
Clay had all household survey data computerized but could not provide a list of the
location and the names of the surveyed households. Because the former regime and its
allies had to evacuate Kigali in a hurry and did not have time to destroy their archives
(they destroyed or stole the computers), I believed I had a small chance of finding the
old surveys. Searching the archives in the ministries of agriculture, economic planning, and their respective statistics departments did not result in a list of the households. However, in August 1999, under a layer of dust in one of the archives, I finally
found the original questionnaires with the location and the names of the heads of
households mentioned on the first page. I found the references of 73% of the original
surveyed households in that archive. From the 10 prefectures, 7 were nearly complete
and 3 were nearly completely missing.
For reasons of budget limitations, however, I could not survey all 1,248 households.
Survey research in general and in Rwanda in particular is very expensive and timeconsuming. In addition, a genocide transition survey is not free from security concerns. The genocide took place in 1994 but persists in Rwandan society today. In the
summer of 2000, I decided to examine three prefectures totaling 352 households surveyed by Professor Clay. The prefectures chosen were Gitarama, Kibuye, and
Gikongoro, with 160 households (10 clusters) in the first and 96 households (6 clusters) in the second and third prefectures. These prefectures were chosen for a variety of
reasons. First, I had the information necessary to locate the households in these prefectures. Second, these areas were safer to work in compared to Ruhengeri or Gisenyi.
Third, Imidugudu policy (villagization) had been implemented to a lesser degree in
these prefectures than in Kibungo and rural Kigali, leaving more hope of finding the
households at the same locations as before the war. Fourth, the prefectures had a mix of
very “successful” genocide (Gikongoro and Kibuye) and less successful genocide
(Gitarama). Fifth, the prefectures had had a sizable Tutsi population before the war.
(This, however, only distinguishes them from the northern prefectures.) Sixth, the prefectures encompass both very poor and not so poor communes.
I had designed the questionnaires for the Genocide Transition Survey and had
decided to proceed in two phases. A team of collaborators, selected at the National
University of Rwanda in Butare (one for each commune, the equivalent of one for each
cluster of 16 households), was to attempt to find the households in the indicated sectors. In the first stage, the collaborators were not to conduct a detailed questionnaire
but to note only a limited amount of information. I wanted first to know whether we
were able to trace the households in their original dwellings. The information to be collected in this first stage included the following:
�Verwimp / DOUBLE-GENOCIDE THESIS FOR RWANDA
427
•
•
•
•
•
Can we locate at least one member of the household surveyed in 1989-1992?
Are the head of household and his wife alive or dead?
What is the ethnic group of the head of household and his wife?
How many members does the household have in 2000?
To what gross category does the head of household belong? Is he or she a survivor of the
genocide, in prison, or abroad?
• What is the age of the head of household in 2000?
The collaborators were told to approach the households in a prudent manner, taking
time to explain that the research was for scientific purposes only and that we were not
part of the Rwandan judiciary, the International Tribunal, or the government. In fact, if
collaborators believed that households were not approachable, they could gather the
information for this first stage of the project by talking to neighbors or government
authorities. Because tracing of households requires extensive knowledge of the area of
residence, I decided to work with collaborators from the communes. However,
because this kind of work is potentially dangerous, I also decided not to take collaborators from the sector where the households were located but from a different sector
within the commune. This would at least give a minimum guarantee of security, save
transportation costs, and make local knowledge of the area of residence available to the
researcher. Relying on earlier tracing done in Indonesia by Duncan, Frankenberg, and
Smith (1998), I decided to choose collaborators with a good knowledge of mathematics. Because the survey is a quantitative research project, collaborators with a good
grasp of mathematics would be helpful not only in the tracing stage of the project (as
they had been in Indonesia) but also in the actual filling out of the questionnaires.
After interviews to select collaborators, the following characteristics determined
my choice:
• a good grasp of mathematics (in practice, this came down to having a university degree);
• having resided in the commune where the interviews take place before and during the
genocide;
• minimum age of 21;
• previous experience in survey research, especially interviewing;
• able and willing to undertake survey research on the genocide;
• whether the candidate-enumerator was on good terms with both the Tutsi and the Hutu
population of his or her commune of origin.
For the first stage of the project, a 1-day training session was organized. Collaborators were told not to be satisfied with one source of information but to cross-check their
information with members of either ethnic group. In the end, I employed 22 collaborators, one for each cluster of 16 households. Eighteen collaborators had a university
degree or were about to finish their university studies. Four collaborators had taken
teacher training during their high school studies and were currently teaching in primary schools. Of the collaborators, 8 were female and 14 were male. Collaborators
came from both ethnic groups, and all originated from the communes where the survey
was to be held.
�428
JOURNAL OF CONFLICT RESOLUTION
The advantage of a tracing exercise is that the researcher has information on the
households that is not available to the collaborators. The 1989-1992 database gave me
a very good instrument to make sure that collaborators found the intended households.
In addition to the data on the households, the researcher had another way of controlling
the tracking done by the collaborators. During the 1989-1992 agricultural survey, the
households were given a solid basket as a kind of reward for their cooperation with the
survey. The collaborators were told to ask whether the household had received this
item and if they still had it. After the first stage, the information supplied by the collaborators was checked with the database, and the researcher was able to criticize unfinished work. Collaborators were also informed that they would have an opportunity to
correct information sheets when they returned to the households for the second stage
of the project.
The 352 households in the prefectures of Gitarama, Kibuye, and Gikongoro that
were interviewed by Clay and the DSA have more than 1,900 household members. In
the first stage of the project, we managed to find information on 340 of these households and on 1,800 persons included in the 1989-1992 survey. This success may be
attributed to the preparation of the tracing exercise and the constant presence in the
field of the researcher, but it is also due to the organization of Rwandan society. Communal authorities have a detailed and well-organized record of all the inhabitants in
each sector and cell. They carefully register every birth, death, or migration in or out of
the commune. The success of the tracing exercise was also due to Rwandan culture:
people on the hills know each other and know of each other’s whereabouts. Even when
a person is not present on the hill, neighbors have information about where he can be
found. Having found information about 1,800 of the 1,900 original people in the survey does not mean that they were all present in their original dwellings, as will be documented in the tables.
DESCRIPTIVE STATISTICS FROM
THE GENOCIDE TRANSITION SURVEY
During the Genocide Transition Survey (GTS), all survey sites included in the
1989-1992 survey in the three above-mentioned prefectures were revisited. The locations of the 10 clusters in Gitarama prefecture and the 6 clusters in the two other prefectures are listed in Table 1.
During the GTS, we found information on 340 of the 352 original households: 155
in Gitarama, 96 in Gikongoro, and 89 in Kibuye. Twenty-seven households had a Tutsi
head of the household. These households, on average, owned less land, had less cattle,
and—in terms of adult equivalents—had the same gross income as Hutu households.3
Table 4 gives an overview of the findings of the Genocide Transition Survey (GTS).
We include 1,926 household members alive in March 1994. From these 1,926, we have
registered the ethnicity in 1,795 cases. Of the household members for whom we were
3. A more detailed study of the economic situation of Hutu and Tutsi households can be found in
Verwimp (2003).
�Verwimp / DOUBLE-GENOCIDE THESIS FOR RWANDA
429
TABLE 1
Survey Sites of the Genocide Transition Survey
Gitarama
Gikongoro
Kibuye
Commune
Sector
Commune
Sector
Commune
Sector
Nyamabuye
Ntongwe
Mugina
Tambwe
Musambira
Runda
Taba
Nyakabanda
Masango
Murama
Mbuye
Gitovu
Mbati
Ntenyo
Gihembe
Ruyenzi
Ngamba
Kagogwe
Munanira
Runyangando
Musange
Rwamiko
Nyamagabe
Nyamagabe
Muko
Kinyamakara
Kigoma
Gorwe
Kibilizi
Kamegeli
Bitandara
Nyarusange
Mabanza
Kivumu
Rutsiro
Gitesi
Gisovu
Bwakira
Mukura
Sanza
Muhira
Buye
Gitabura
Nyabinombe
TABLE 2
Descriptive Data by Prefecture (n = 340)
Number of households in Genocide Transition Survey
With Hutu head of household
With Tutsi head of household
With Twa head of household
With ethnicity unknown
Gitarama
Gikongoro
Kibuye
155
133
17
5
0
96
90
5
0
1
89
81
5
0
3
NOTE: For 12 households, no information at all could be found during the Genocide Transition Survey.
TABLE 3
Overview of Economic Characteristics by Ethnic Group (Averages)
Land owned (area)
Land rented (area)
Value of livestock (in RwFb)
Gross Y per household
Household size
Gross Y per adult eq.
% Never went to school
Live births to mother
Live births still living
All Households
(n = 329)
Hutu
(n = 287)
Tutsi
(n = 25)
Twa
(n = 4)
90.8
7.1
9,388
41.480
5.2
9,622
56.7
4.69
3.95
93.2
7.5
9,418
41.865
5.1
9,804
57.3
5
4
75.4
4.0
7,393
46.931
5.3
9,893
32.0
4
3
12.4
0
6,300
12.189
NOTE: Not all pre- and postgenocide information was complete for all households.
a. 100 are = 1 hectare.
b. RwF = Rwandan francs.
2,664
100.0
9
8
�430
JOURNAL OF CONFLICT RESOLUTION
TABLE 4
The Population Evolution from March 1994 to 2000,
Calculated from the Genocide Transition Survey (n = 1,926)
Hutu
Number alive March 1994 = 1,926; missing data
a
in 2000 = 131
Ethnicity registered
Number alive in 2000
Fate unknown in 2000
Dead by 2000
Death
Dead by 2000
Died in 1994
Died 1995-2000
Year of death unknown
Cause of death (year known and unknown)
Cause of death unknown
Number of natural deaths
b
Number of violent deaths
Killed by Interahamwe
Killed by FAR
Killed by RPF
Killed by other
Killer unknown
Tutsi
Twa
n
%
n
%
n
%
1,620
1,344
111
165
100
82.9
6.8
10.1
151
62
0
89
100
41.0
0
58.9
24
13
5
6
100
54.1
20.8
25.0
165
45
73
47
100
27.2
44.2
28.4
89
79
4
6
100
88.7
4.4
6.7
6
4
1
1
100
66.6
16.6
16.6
0
5
1
100
10
112
43
9
1
21
5
7
100
20.9
48.8
11.6
16.2
0
10
79
67
6
100
84.8
7.5
6
7.5
1
NOTE: FAR = Rwandan armed forces; RPF = Rwandan Patriotic Front.
a. Missing indicates that for a number of household members of the 1989-1992 survey, no information
could be obtained, meaning that neither were they present in their original dwellings, nor could we register
any information from informants or neighbors on these individuals.
b. Death in Congo, Burundi, or Tanzania was registered as violent death unless the person interviewed
stated that the death was not directly related with war. Granted, this is very difficult to say for Congo, but
from the 112 deaths of Hutu registered as “natural deaths,” only 4 were located in Congo.
able to register their ethnicity, 90% are Hutu, 8.4% are Tutsi, and 1.6% are Twa. Of the
Tutsi in the sample, only 41% survived the genocide and the postgenocide period until
2000 (the moment of the GTS) compared with 83% of the Hutu and 54% of the Twa
(both violent as well as natural deaths). Some readers familiar with the death toll of
Tutsi during the genocide may find a survival percentage of 41% quite high. There is a
growing consensus in the research community that only about 20% to 25% of all Tutsi
residing in Rwanda at the time of the genocide survived (Des Forges 1999, 15). We will
soon discuss why the survival percentage of Tutsi in our sample is higher. Seventynine (out of 89) Tutsi, meaning 88.7% of the deceased Tutsi, were killed in 1994, compared with 45 (out of 165) Hutu, meaning 27% of the deceased Hutu.4 Almost all Tutsi
who had died by the time of the survey were killed in the genocide. We registered only
4. This may be an underestimation because we do not have the year of death of 28% for the deceased
Hutu.
�Verwimp / DOUBLE-GENOCIDE THESIS FOR RWANDA
Figure 1:
431
Survey Sites of the Genocide Transition Survey
4 Tutsi killed in the period from 1995 to 2000. Of all violent deaths of Tutsi, 85% were
caused by execution by Interahamwe and 7.5% by soldiers of the Rwandan armed
forces (FAR). The majority of violent deaths of Hutu (48%) were caused by execution
by the RPF.5
Of the registered violent deaths of Hutu, 21% had been executed by the Interahamwe.
Although we reached a very high level of attrition (93.2%, 1,795 of 1,926) in our survey, we do not know whether a number of Hutu were still alive in 2000 because of their
flight to the Congo (or how they had been killed). This means that in our sample, about
52% (79 of 151) of all Tutsi residing at the survey sites in March 1994 were killed in the
weeks after April 6, 1994. The genocide of the Tutsi population has thus clearly left its
traces in our sample. Another element of the mass slaughter campaign, traceable in our
sample as well, is the killing of Hutu by the Interahamwe and the FAR, who account
for 10 out of 43 registered violent deaths among Hutu. Thus, the 1994 genocide has
also claimed 0.6% (10 of 1,620) of the lives of the Hutu in our sample. Furthermore,
the RPF claimed (Hutu) lives, 21 to be exact, almost half of all violent deaths of Hutu,
equaling 1.3% of the Hutu population residing in the survey sites.
5. The term interahamwe is used as a general description for civilians taking part in attacks and killings, not strictly for Mouvement Republicain National pour le Dévéloppement (MRND)youth or organized
militia.
�432
JOURNAL OF CONFLICT RESOLUTION
TABLE 5
Losses of Household Members per Household
Because of Genocide or Civil War (Natural Death Excluded)
Hutu
% of Households
With information on all household members
No losses of members
One member lost
More than one member lost
All members lost
a
With information missing on one member
No losses of members
One member lost
More than one member lost
All members lost
a
With information missing on two members
No losses of members
One member lost
More than one member lost
All members lost
a,b
With information missing on > two members
No losses of members
One member lost
More than one member lost
All members lost
n
208
191
12
5
0
39
35
3
1
0
23
22
1
0
0
17
15
1
1
0
Tutsi
%
91.8
5.8
2.4
0
n
24
2
7
7
8
0
0
0
0
0
2
1
0
1
0
0
0
0
0
0
Twa
%
8.3
29.2
29.2
33.3
n
%
Total
3
3
0
0
0
0
0
0
0
0
0
0
0
0
0
2
1
1
0
0
100
100
0
0
0
235
196
19
12
8
39
35
3
1
0
25
23
1
1
0
19
16
2
1
0
a. Data include only the members on whom we found information.
b. For 8 Hutu households (not included in the 17), data on all members are missing; for 7 other households,
all data, even on ethnic affiliation, are missing. Elsewhere, it is explained that despite these missing values,
an attrition rate of 93% on an individual and household level is very good for a panel survey, especially when
we have taken the period of 10 years in between two rounds into account, a period ravaged by genocide and
civil war.
Table 5 presents data at the household level. It is shown that only 2 out of 27 Tutsi
households did not lose one or more members due to violent death in genocide or civil
war. This accounts for 7.5% of all Tutsi households and for 8.3% of Tutsi households
with no information missing. In comparison, 191 out of 295 Hutu households did not
lose any member because of genocide or civil war. This accounts for 64.7% of all Hutu
households and for 91.8% of Hutu households with no information missing. It is
important that we failed to register data on the status of life or death of one or more
members in 87 (39 + 23 + 17 + 8) Hutu households. This is a large number, but it does
not mean that the data we found on the other members of these households are incorrect. In effect, 72 out of these 87 households (83%) reported having not lost a member
in violent death (missing persons were excluded). Adding this 72 to the 191 households mentioned above reveals that 89% of all Hutu households reported not having
lost a member who died violently. Of course, the necessary reservations for the missing members in these 72 households must be taken into account.
�Verwimp / DOUBLE-GENOCIDE THESIS FOR RWANDA
433
A large majority of the Tutsi in our sample, 67% to be exact, originated from the
prefecture of Gitarama. Forty-three of the 104 Tutsi from Gitarama were killed in the
genocide, 3 died after the genocide, and the fate of 6 Tutsi from Gitarama was not registered in the GTS. This means that almost half of the Tutsi, who were alive in March
1994 and living in Gitarama, survived the genocide. This, in effect, explains the relatively high overall survival percentage in our sample. The other prefectures show a
totally different picture. Of the 28 Tutsi in our sample who we know were living in
Gikongoro in March 1994, only 3 were still alive in 2000. The 25 others were killed in
the genocide. This is a survival percentage of only 10.7%. The data for Gitarama confirm other research, particularly the seminal account of the genocide by Alison Des
Forges (1999), that the genocide in Gitarama was less intense (at least in the number of
Tutsi killed) compared with other prefectures. Des Forges writes that
the combined pressure by political and military authorities, militia, and the radio succeeded in destroying open opposition to the interim government and its genocidal program in Gitarama. But the killing campaign failed to exterminate all the Tutsi of the
region, in part because Hutu officials and ordinary people continued to aid Tutsi, even if
only furtively, and in part because the rapid assemblage of thousands of Tutsi at Kabgayi
created an agglomeration protected by its sheer size. From the start many Tutsi had fled
spontaneously to the extensive grounds of the Catholic diocese at Kabgayi. Governmental authorities also encouraged and helped Tutsi to assemble there, some of them believing that people at risk were safer at Kabgayi than in their home communes, others because
they understood that gathering Tutsi together was part of the genocidal plan. Military and
militia never launched an open assault on the extensive camps, but were preparing to do
so when the RPF took Kabgayi in early June. (P. 277)
An interesting feature of the GTS is that our findings demonstrate this difference: from
a random sample of households surveyed in the framework of an agricultural research
project before the genocide, we have found that Tutsi members of the surveyed households had a far better chance to survey the genocide when they were living in the prefecture of Gitarama than in Gikongoro. Interestingly, the situation is reversed for Hutu.
Hutu living in Gikongoro had a higher chance not to be killed in the genocide or civil
war than Hutu living in Gitarama. The latter finding can be explained by the absence of
battles between the RPF and the FAR in Gikongoro, which, in turn, is explained by the
refusal of the French army to allow the RPF to enter Gikongoro during Operation Turquoise. The survey features only Twa in Gitarama who had the lowest chance to be
killed in either the genocide or the civil war.
The data presented in Table 6 seem to suggest that the early arrival of the RPF had a
double consequence: some Tutsi were saved, and some Hutu were killed. The regression analysis will check whether this observation can be substantiated.6
6. For a detailed description of massacres committed by the RPF in the prefecture of Gitarama, I refer
to Ndahayo (2000, 111-23). Ndahayo is from Gitarama and served as the executive secretary of the Movement Democratique Republicain (MDR) in 1994 and 1995. He finds that the RPF killed 18,000 people in
Gitarama prefecture. This represents 2.2% of a total Hutu population (800,000) in Gitarama at the time of
the genocide. Compared to my own estimates, based on the sample of rural households in Gitarama,
Ndahayo’s estimate seems realistic.
�434
JOURNAL OF CONFLICT RESOLUTION
TABLE 6
Percentage Killed, by Ethnic group and Prefecture (n = 1,795)
% Killed in Genocide
a
and Civil War
Gitarama
Hutu
Tutsi
Twa
4.4
45.1
3.8
Average number of days after April 6, 1994, before Rwandan
b
Patriotic Front arrived at the survey sites (commune level)
65
Gikongoro
0.6
89.2
215
Kibuye
1.6
47.8
105
NOTE: When translating (extrapolating) these figures to the national level, one has to take into account that
(1) because of the early arrival of the Rwandan Patriotic Front (RPF) in Gitarama, more Tutsi survived in
Gitarama compared to Butare, the prefecture with the largest Tutsi population in Rwanda. Nationwide, a
larger percentage of the Tutsi was killed than in our sample. (2) Most probably, more Hutu were killed by the
RPF in Gitarama (and in Kigali, Kibungo, Byumba) compared to the southern prefectures of Gikongoro,
Butare, Cuyangugu, and Kibuye because of the civil war effect (battle), revenge killings, and arbitrary executions by the RPF. (3) Figures for violent death among Hutu are underreported because of missing data due
to flight of a number of Hutu to the Congo.
a. These figures are the number of violent deaths per ethnic group per prefecture. The figures for Hutu are
underreported because the fate of a number of Hutu was unknown. This number, however, is such that it does
not change the overall picture of differences between ethnic groups and between prefectures. Hutu killed in
the Congo, when registered, are included among the dead. The fact that the fate of a number of Hutu is unknown (compared to Tutsi) is mostly due to their flight to neighboring countries.
b. Averages over 10 communes in the prefecture of Gitarama and over 6 communes in the two other prefectures.
ETHNIC DATA AND THE DOUBLE-GENOCIDE THESIS
To distinguish the killings committed by the Interahamwe and FAR, on one hand,
and by the RPF, on the other hand, I will analyze the mortality pattern of the Hutu and
Tutsi in my sample. Who was killed by whom? Where did the killings take place?
When did they take place? Were whole families killed at the same time in the same
place? Were the killings linked to a particular event? What was the identity of the killer
and of the victim?
From the household-level data, it is clear that 1 out of 3 Tutsi households in the
pregenocide sample lost all of their household members in 1994. Almost the same percentage of Tutsi households lost more than one (but not all) of its members. Of these
households (taken together, they account for 15 out of 25 of Tutsi households with data
on all members), 11 lost their members on the same day. They were exterminated that
day (see Table 7).
In comparison, none of the 191 Hutu households with data on all members lost all of
its members. Taking households with data missing on some of their members into
account, we find that 24 households (8.1% of 295) lost one or more of its members violently. From these descriptive data at the household level, we thus observe a clear ethnic pattern—namely, that many (in our sample 15 out of 25 households) Tutsi residing
�Verwimp / DOUBLE-GENOCIDE THESIS FOR RWANDA
435
TABLE 7
Number and Percentage of Households of Which at Least Two
Members Were Killed on the Same Day and at the Same Place
Ethnic Affiliation of the Head of Household
Hutu
Tutsi
Twa
Number
Total
%
5
15
2
304
27
5
1.6
55.0
40.0
in Rwanda were killed with their family members, most often on the same day.
Although the number of Hutu killed in our sample is high in absolute numbers (43,
compared with 79 Tutsi), the large majority of Hutu in our sample (more than 90%)
were not killed in the first place. Old age and disease also took their tolls. When murdered, most Hutu killed in the sample were found to be the only casualty in the household. Rarely were members of Hutu households killed on the same day and in the same
place. From the data, it is difficult not to conclude that the patterns of killing were different for Tutsi and Hutu.
Whatever one’s position on the double-genocide thesis (i.e., that both the former
regime and the RPF committed genocide), our research in Gikongoro, Gitarama, and
Kibuye shows that many people were killed, both Tutsi and Hutu, but the killing pattern in the period between 1994 and 2000 was clearly different for both groups. Simply
stated, we physically found and located more than 82% (1,344 out of 1,620) of the
members of the Hutu households included in the 1989-1992 agricultural household
sample. Of the remaining 17% (276 members), 111 were missing (i.e., their fate is
unknown) and 165 were dead. Of these deaths, 112 people were reported to have died a
natural death. Regarding the 131 missing (whose ethnicity and living or death status
are unknown), it should be pointed out that even panel surveys without the advent of
war, large-scale massacres, or mass migration lose households and household members in subsequent rounds of the survey because of individual migration, job search in
the city, marriage in another village, and so on. Given Rwanda’s recent history, our
attrition rate (93%) is very, very high. One may argue that some of these “natural”
deaths were, in fact, killed by the RPF. (I have no proof of this, but I am ready to accept
some false testimonies.) The number killed by the RPF cannot be that large, however,
because, in the course of almost 10 years between the surveys, at least some Hutu in this
sample must have died from disease (malaria, AIDS) or old age.
THE SPATIAL DISTRIBUTION OF KILLING
In this section, I examine the places were Hutu and Tutsi were killed in relation to
the places were the murdered person was residing before the genocide. In this way, we
�436
JOURNAL OF CONFLICT RESOLUTION
TABLE 8
Comparing the Pattern of Killing of Hutu and Tutsi in the Sample
Tutsi
Hutu
Number of observations
Number killed
Percentage killed
Time frame of killing
155
79
52
1994
1,620
43
2
1994, 1995-1998
Identity of killers
Interahamwe
FAR
Area of residence, neighboring
communes, church of Kibeho,
Kigali
Household members often
killed on the same day and
at the same place
RPF
Interahamwe-FAR
Congo, camp of Kibeho, Mukingi,
Kigali
Places
Overall pattern
Households often have no member
killed, one member killed, or one
or more members lost in Congo
NOTE: RPF = Rwandan Patriotic Front. FAR = Rwandan armed forces.
can trace the spatial distribution of the killing process during the genocide and the civil
war.
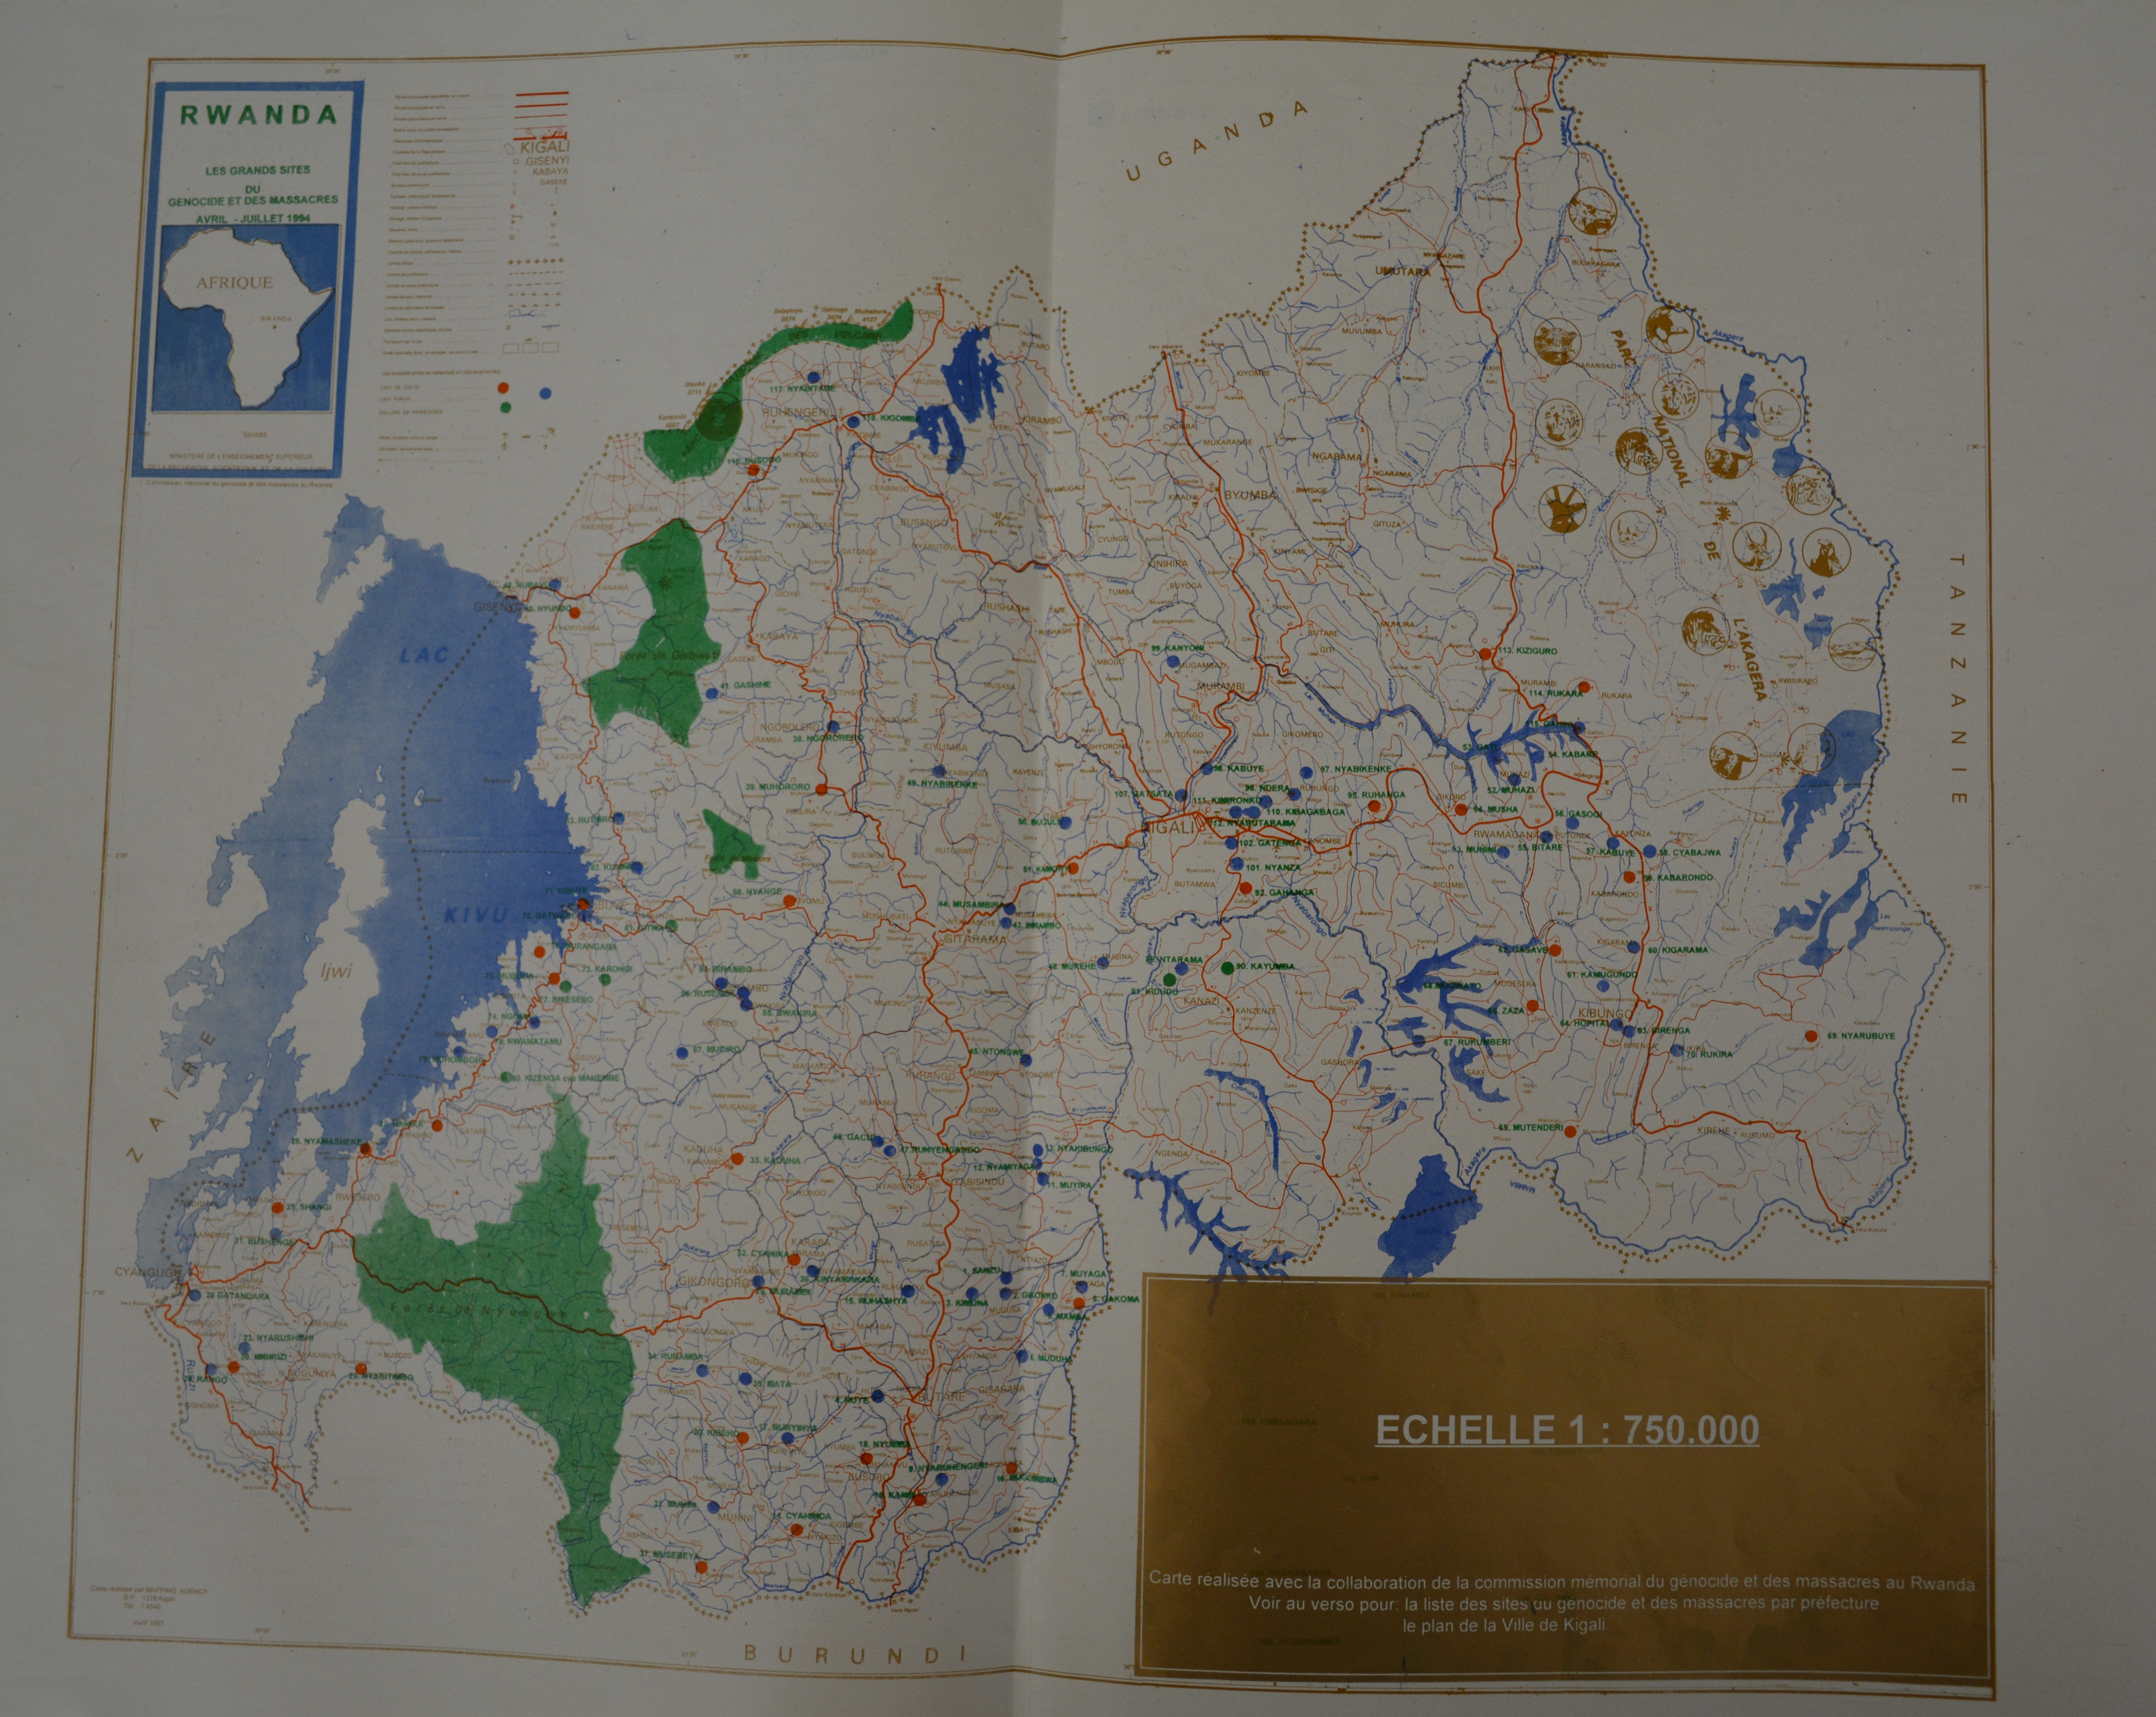
When one or more members from the survey site were killed outside the commune
of residence, a line is drawn on the map between the survey site and a small triangle or a
small circle (see Figure 2). A triangle indicates Tutsi deaths, and a circle indicates
Hutu deaths. No line was drawn when members of the sample died in their own commune. Take Masango commune in Gitarama prefecture (bordering Kibuye and
Gikongoro prefectures), for example: Tutsi members from Masango commune included
in the sample were killed in the commune. This is symbolized by the small triangle
without a line linking the cross and the triangle. Hutu members from the sample in
Masango were killed in the Kibeho camp, in the commune of Rwamiko, Gikongoro
prefecture. This is symbolized by the line drawn between the cross indicating the survey site and the small circle in Rwamiko commune indicating the death of Hutu.
Both Hutu and Tutsi were killed inside as well as outside their communes of origin,
but more Tutsi than Hutu included in the sample died in their own communes. Fourteen
Tutsi from the survey site in Rwamiko commune, for example, were killed in the
church of Kibeho. Tutsi from the survey sites who were killed outside their communes
of origin mostly died in Butare prefecture. We also found that 5 Tutsi were thrown into
the Nyabarongo River. Hutu included in our sample mostly died in Kigali, in a neighboring commune, or in the Congo. To recapitulate, places where Tutsi in our sample
were killed include the church of Kibeho, in Kigali, at the place of residence, and in the
Nyabarongo River. They all died in 1994. Places were Hutu in our sample were killed
include Mukingi (1994), in the camp of Kibeho (1995), in Congo (1996), and in their
place of residence (1997).
�Verwimp / DOUBLE-GENOCIDE THESIS FOR RWANDA
437
Figure 2: The Spatial Pattern of Killing
NOTE: *indicates a survey site. Lines indicate when one or more members from the survey site were killed
outside the commune of residence. Triangles denote Tutsi deaths; circles denote Hutu deaths.
ANALYSIS OF SURVIVAL CHANCES
In an analysis of survival chances, I want to identify the determinants of a person’s
probability of surviving the genocide and the civil war. Econometrically, this is done
by the use of a logistical regression technique in which the variable at the left-hand side
of the equation is a dummy variable capturing the death (1) or life (0) status.
Formally,
Prob(y = 1) = L(Σk βk xk),
with xk = personal, household, and local characteristics.
The right-hand side features a number of personal, household, and local variables
that explain the life or death status of the individual. One must make a distinction
between a “natural” and a “violent” cause of death. Therefore, I first perform a regression
using a binary method and, in the next section, a multinomial regression technique.
Explanatory variables include the following:
�438
JOURNAL OF CONFLICT RESOLUTION
At the personal level
Age and age square of the individual
Sex of the individual (male = 0, female = 1)
Ethnic affiliation of the individual (Hutu = 0, Tutsi = 1)
Income the individual earned outside the family farm, in logarithmic terms
At the household level
Area of land owned by the household, in acres
At the level of the commune
Number of days after April 6, 1994, that the RPF reached the survey site
An interaction term between the ethnic variable and the RPF-arrival variable
A constant term
The regressions show that age, sex, and ethnicity strongly determined a person’s
chances of dying violently in Rwanda during the past decade in all three regressions. In
the first regression, in which the dependent variable takes the value of 1 in the event of
both a natural and a violent death, the ethnic effect is significant at the 12% level. The
significance of the ethnic effect increases strongly in the other two regressions, in
which the dependent variable is equal to 1 only in cases of violent death. It is thus clear
that Rwandan Tutsi in our sample were killed because of their ethnic affiliation. The
regressions also show that women had a better chance of survival than men. The computations of the marginal effects of the variables in the third regression show that sex
and ethnicity have the most impact on one’s probability of violent death in Rwanda,
with the latter effect three times stronger then the first.
The earning of an off-farm income has no significant effect in any of the three
regressions. Members of households who owned large land properties, however, had a
higher chance of dying violently during the last decade of Rwanda’s turbulent history.
This means that, apart from ethnicity, other regularities can be observed in the killing
process.
The number of days between the shooting down of Habyarimana’s plane on April 6,
1994, and the arrival of the RPF on the survey site also has a significant effect. The
more days between these dates, the lower one’s chances for violent death. This civil
war effect, however, is in its turn corrected for when it is interacted with the ethnic variable. The sooner the RPF arrived at the survey site, the fewer Tutsi were killed (the
lower the chance of Tutsi to be killed). The marginal effect shows that the probability
of Hutu to die violently after the arrival of the RPF decreased by 1% for each month
after April 6, 1994. The probability for Tutsi to die violently increased by 2% for each
month after April 6, 1994, and when the RPF arrived at the survey site.7 From the size
of the marginal effects, it can be derived that the “Tutsi-saving” effect of the arrival of
the RPF at the survey site was two times larger than the “Hutu-killing” effect of that
arrival.
I have already mentioned that fewer Hutu died in Gikongoro than in Gitarama
because of the late arrival of the RPF in Gikongoro. They were not allowed in by the
French Operation Turquoise. Econometrically, it is not easy to account for Operation
7. This is, as far as I know, the first time that the effect of the arrival of the RPF on the survival
chances of both Hutu and Tutsi is demonstrated in a regression analysis.
�Verwimp / DOUBLE-GENOCIDE THESIS FOR RWANDA
439
TABLE 9
Bivariate Logistical Regression Results Explaining Violent Deaths, 1994-2000
Alive =
0/Natural
or Violent
Death = 1
Alive or
Natural Death =
0/Violent
Death = 1
Variables
Coefficient
Coefficient
Coefficient
AGE
0.031**
(2.15)
0.0008
(0.47)
–0.485***
(–2.78)
0.699*
(1.56)
–0.037
(–1.10)
–0.001
(–1.11)
0.059**
(2.46)
–0.004
(–1.44)
–0.932***
(–3.37)
1.426**
(2.46)
–0.026
(–0.50)
0.0036**
(2.29)
0.0561**
0.0012
(2.27)
–0.0003
(–1.00)
–0.926*** –0.0208
(–3.32)
1.5004*** 0.0611
(2.57)
–0.033
(–0.63)
0.0035** –0.000
(2.18)
–0.006***
(–3.92)
–0.014***
(–3.31)
–0.014***
(–3.37)
–0.0003
0.022***
(4.51)
–2.15***
(–7.28)
1,539
–491.26
0.226
0.031***
(4.70)
–3.452***
(–6.38)
1,539
–225.65
0.437
0.030***
(4.58)
–3.349***
(–6.16)
1,429
–218.14
0.444
0.0006
2
AGE
SEX
ETHNIC
OFF-FARM Y
LAND OWNED
Number of days after April 6
before RPF reached site
ETHNIC × Number of Days
after April 6
Constant
Number
Log likelihood
2
Pseudo-R
Alive = 0/
Violent
Death = 1
Marginal
Effect
NOTE: Values are coefficients, z values in parentheses. RPF = Rwandan Patriotic Front. Marginal effects
only computed for significant variables.
*p < .12. **p < .05. ***p < .01.
Turquoise. The data for the arrival of the RPF are specific for each survey site, and they
vary for the Gikongoro sites from 139 days (after April 6, 1994) to 270 days. The
French arrived in Gikongoro about 85 days after April 6, 1994.8 One way to capture an
effect for Gikongoro that is not observed in Gitarama (and in Kibuye)9 is to use a
dummy variable for Gikongoro. It is, however, not sure if this procedure really corresponds to reality, meaning that the French army was really occupying (and thus stopping the killing) soon after their arrival over the whole area of our survey sites. A
dummy can also capture other effects for Gikongoro that we are not aware of. Nevertheless, to test the robustness of our analysis, we have introduced a dummy for
8. We cannot replace the dates the RPF arrived at the Gikongoro sites by 85 because then we would
no longer distinguish between the effect of the French arrival at Gikongoro sites and the RPF arrival at
Gitarama sites.
9. The problem of the arrival of the French versus the arrival of the RPF in Kibuye prefecture in terms
of days after April 6, 1994, is very small because it almost coincided.
�440
JOURNAL OF CONFLICT RESOLUTION
Gikongoro. It had no significant effect and did not change the effects of the other variables. We can conclude this section saying that the French army saved a number of
Hutu lives in Gikongoro by delaying the entry of the RPF in that prefecture, at the cost
of a number of Tutsi lives.10
This analysis shows that the probability of a Hutu being killed by the RPF was
higher in 1994 compared with 1995, 1996, or later. What kind of killings were these?
Were they revenge killings—revenge in the sense that the RPF killed Interahamwe
because the members of that militia killed Tutsi in the days, weeks, or months before
the arrival of the RPF? Did the RPF just kill Hutu citizens at random upon their arrival
in a survey site? Were RPF killings related to a prior attack?
In our data, we have found that of the 43 Hutu who were killed violently, 21 were
killed by the RPF. Of these 21 Hutu, 10 were killed in 1994; 3 of these 10 victims of
RPF bullets in 1994 were known as Interahamwe in their cells of residence. They participated actively in the genocide. The other 7 killings cannot be linked with the activities of the victim during the genocide. Two out of 21 were killed in the massacre of the
Kibeho refugee camp in 1995, and 5 were killed in 1997 after an infiltration attack by
former FAR and Interhamwe in northern Rwanda. In two Hutu households, we have
found members killed by the RPF on the same day and in the same place. Apart from
the first 3 persons killed in 1994, none of the other victims were known as Interahamwe.
From our fieldwork in Gitarama, Gikongoro, and Kibuye, we conclude that half of
the RFP killings cannot be linked to a particular event; a number of RPF killings in
these prefectures can be categorized as revenge killings; a number of RPF killings in
the sample can be attributed to the massacre in the Kibeho refugee camp (Gikongoro
prefecture); and a relatively large number of killings in north Gitarama can be regarded
as terror and harm inflicted on the civilian Hutu population after an insurgency by former FAR and Interahamwe.11
The results of the multinomial regression in Table 10, in which the dependent variable is not a binary choice variable, strengthen the effects already observed in the
binary case. They show again that age, sex, and ethnicity have a significant effect on
the probability of dying violently. The effect of the land variable in this multinomial
regression takes away the ambiguity of land in the binary regression. Landlords indeed
have a higher chance of dying violently and a lower chance of dying naturally compared with less landed people. As before, the number of days after April 6, 1994, that
the RPF arrived at the survey sites is also very significant, as is the interaction between
this variable and the ethnic variable in the explanation of violent death. The later the
RPF arrived at the survey sites, the lower one’s probability of dying violently, unless if
one were a Tutsi. The effect of the RPF arrival on the probability of dying from a natural cause is somewhat puzzling. The arrival of the RPF at the survey site apparently
increased one’s probability of dying from disease or illness (natural death). This may
10. This does not mean that the French did not save Tutsi in Gikongoro. Within the limits of our data
(96 households, of which 5 were Tutsi households), we do not observe such an effect.
11. We found evidence that in the northern part of Kibuye and Gitarama prefectures (we did not do
field research in Gisenyi or Ruhengeri), a small number of young people, who were not part of the
Interahamwe during the genocide, joined Interahamwe and ex-FAR (Rwandan armed forces) in 1997 and
1998 when these forces mounted an insurgency in northern Rwanda.
�Verwimp / DOUBLE-GENOCIDE THESIS FOR RWANDA
441
TABLE 10
Selection into Natural or Violent Death: A Multinomial Logit Regression
Violent Death
Variables
AGE
2
AGE
SEX
ETHNIC
OFF-FARM Y
LAND OWNED
Number of days after April 6 before
RPF reached site
ETHNIC × Number of Days after April 6
Constant
Coefficient
Natural Death
z Value
Coefficient
z Value
0.0054***
–0.00003
–0.9353***
1.4294**
–0.0286
0.003**
2.24
–0.97
–3.37
2.45
–0.55
2.08
0.0231
0.0002
–0.244
2.6471
–0.0376
–0.003***
1.32
1.02
–1.13
1.26
–0.88
–2.60
–.014***
.033***
–3.279***
–3.41
4.65
–6.07
–0.0046***
–0.0572
–2.419***
–2.76
–1.33
–6.81
2
NOTE: Number of observations = 1,539. Log likelihood = –569.59. Pseudo-R = 0.278. Dependent variable =
status: alive, violent death, or natural death. RPF = Rwandan Patriotic Front.
**p < .05. ***p < .01.
have to do with the problem of getting medical treatment during civil war or with the
decline of living standards during civil war. In that respect, it is important to note that
humanitarian aid organizations complained vigorously during the genocide about the
RPF refusal to allow them to deliver aid or assist the needy.
CONCLUSION
In a survey in the prefectures of Gitarama, Gikongoro, and Kibuye, evidence was
found of killings of Hutu and Tutsi by Interahamwe, FAR, and RPF. One out of 3 Tutsi
households in the pregenocide sample had all its members exterminated in 1994, very
often on the same day and in the same place by the same people. Only 2 of the 27 Tutsi
households (8.3%) reported no members lost during the genocide. This genocidal pattern is not found in the killings of Hutu household members. From the Hutu households with full information on all members, 91% reported not to have lost members
who died violently. Even when a number of false testimonies and missing information
on members of Hutu households who stayed or died in Congo are accepted, the pattern
of killing of Hutu and Tutsi was clearly different. In effect, we have traced and found,
in a material and physical sense, a large majority of Hutu households from the
pregenocide sample, including wives and children. This is not the case for most members of Tutsi households. We therefore argue that for those prefectures in which we
performed our fieldwork, the term genocide should be reserved for the killings committed by the Interahamwe and the FAR, and another word should be used for the killings committed by the RPF. That word could be massacre or terror or another word,
depending on the event.
�442
JOURNAL OF CONFLICT RESOLUTION
Using regression analysis, it was found that age, sex, ethnic affiliation, the size of
one’s land, and the number of days it took the RPF to reach the survey site determined
one’s chance for survival. Older people, men, Tutsi, and land-rich people had a higher
probability of dying violently compared with young people, women, Hutu, or landpoor people. More Tutsi survived the genocide and more Hutu died violently the
sooner after April 6, 1994, that the RPF reached the survey site.
REFERENCES
Des Forges, A. 1999. Leave none to tell the story. New York: Human Rights Watch.
Desouter, S. 1995. Ruandese leugens moeten ontmaskerd worden [Rwandan lies should be unmasked]. CIP
WB, 26 July.
. 2002. L’usage usurpé du terme de génocide. Retrieved April 30, 2002, from www2.minorisa.es/
inshuti/desouter.htm
Desouter, S., and F. Reyntjens. 1995. Rwanda: Les Violations des Droits de l’ Homme par le FPR/APR,
Plaidoyer pour une enquête approfondie. Working paper, University of Antwerp, Institute of Development Policy and Management.
Duncan, T., E. Frankenberg, and J. Smith. 1998. Lost but not forgotten: Attrition in the Indonesian Family
Life Survey. Paper presented at the Conference on Data Quality in Longitudinal Surveys, October, Institute for Social Research, University of Michigan.
Ndahayo, E. 2000. Rwanda: le dessous des Cartes. Paris: l’ Harmattan.
Reyntjens, F. 1996. Rwanda: Genocide and beyond. Journal of Refugee Studies 9 (3): 240-51.
Verwimp, P. 2000. Genocide Transition Survey. First round, Economics Department, Catholic University of
Leuven.
. 2003. Development and genocide in Rwanda: A political economy analysis of peasants and power
under the Habyarimana regime. Ph.D. diss., Economics Department, Catholic University of Leuven.
�